Once the data has been successfully recorded, ibaAnalyzer can perform an offline analysis.
Note |
|
|---|---|
|
The ibaCapture Server, where the videos are stored, must be accessible for the computer with ibaAnalyzer via the network. |
|
In the following, it is assumed that you have created an analysis and added signals to one or more graphs.
If a data file also contains ibaCapture video data, the signal tree also includes the ibaCapture modules in addition to the measured values.

Displaying a video
-
To display a video, drag and drop the video signal (green camera icon) into the recorder window or double-click on a video signal.
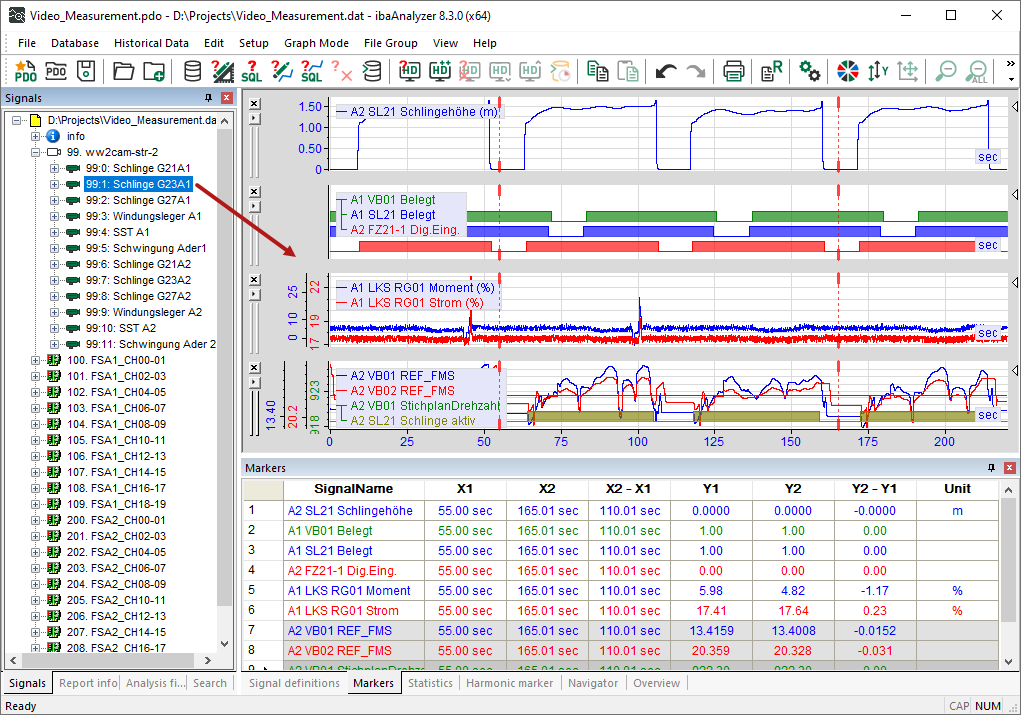
A video player opens up playing the selected video.
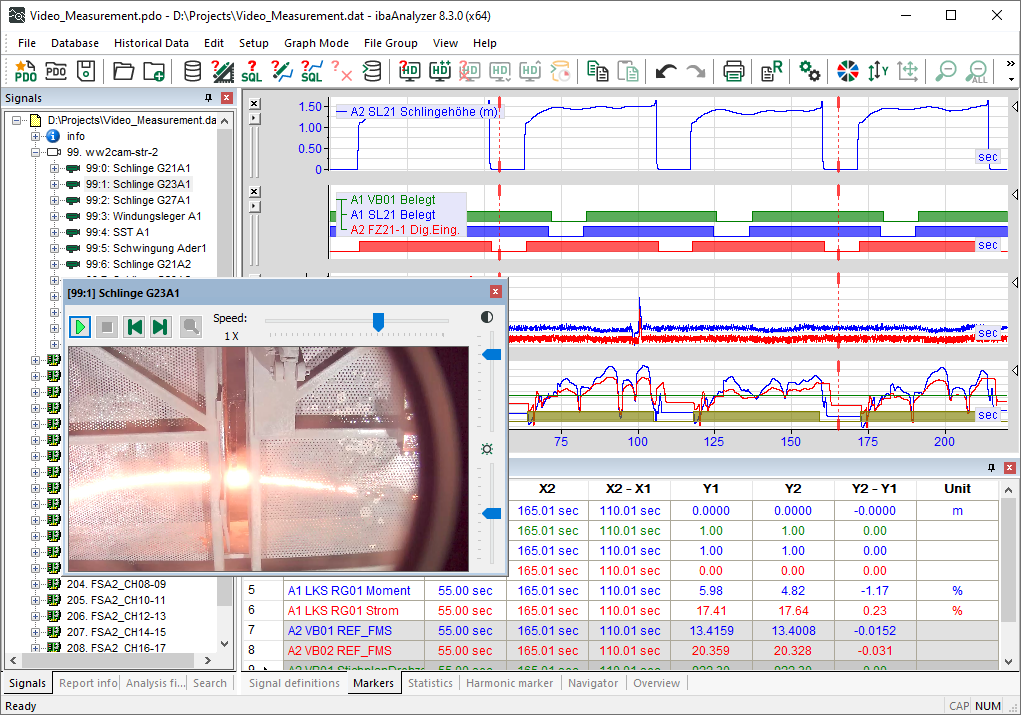
Each video signal is opened in a separate window.


For more information on analyzing measurement data and video data, see Analysis of measurement signals based on video recording.
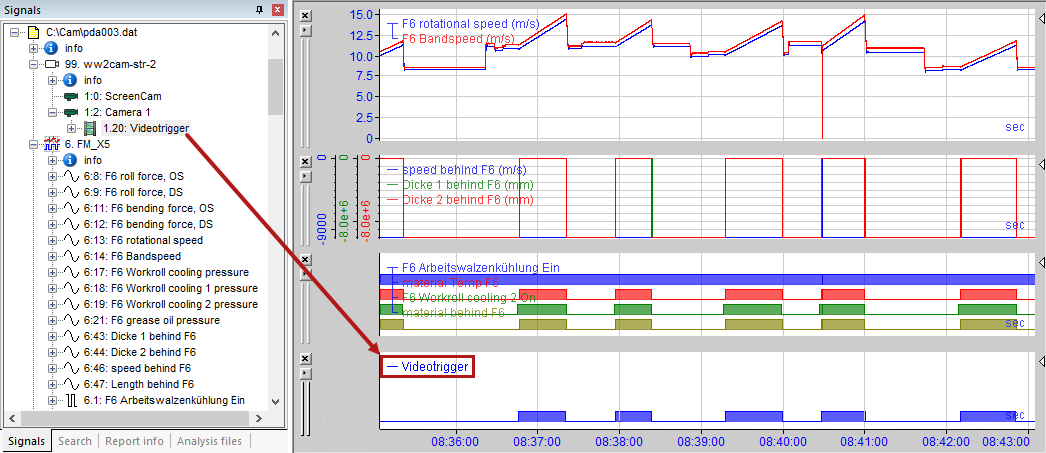
Displaying videos with trigger signal
If videos have been recorded based on a trigger signal, you can display the signal and the video sequences.
-
To display triggered video sequences, drag and drop the video trigger into the recorder window or double-click on the trigger signal.
The trigger signal appears in a new graph.
-
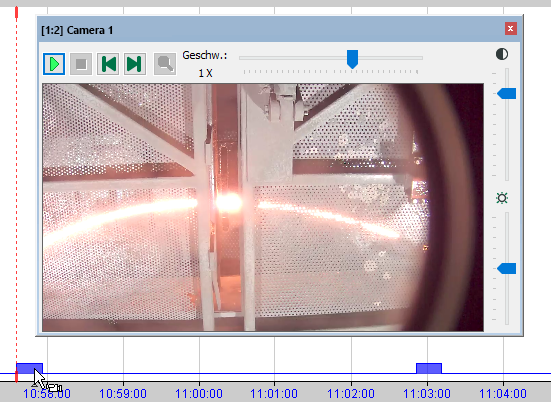
To open the corresponding video sequence, double-click on the trigger signal.
-
If video signals are open in addition to the trigger signal, you can change the video image by moving the X1 marker.

Positioning the video window
You can move the video window with the mouse and dock it at various points in the ibaAnalyzer window.
If you change the size of the video window, the image proportions remain the same.

To undock the window, double-click on the window header or drag the header to a different position.