For the bar chart, further functions can be enabled here: Limit values, bandwidth and profile coefficients.

For the profile display, single polynomial coefficients or a value field (2D vector signal) can be used. The signal assignment for this is done easily by dragging the desired signal with the mouse from the adjacent signal tree to the corresponding line in the table. If no signal has been assigned to an object, it will not be displayed. Except for the bars which will always be displayed.
The signal values, which can be assigned to the profile curve, will be used as coefficients in a polynomial of the fourth order. If no signal is assigned, the corresponding coefficient is zero.
If the box Display limit lines is not enabled, no horizontal limit lines will be displayed. Nevertheless, the limits are enabled and the bars will be shown in a different color when exceeding the limit value, unless a corresponding signal was assigned to the limit values. If the profile curve is limited to the strip, the profile is only visible within the range of the strip width. With the value Pen width (in dots), the thickness of the profile curve is configured.

Another possibility to assign signals to a profile is the dragging of a valid signal (analog or vector signal) or a signal group from the signal tree in ibaPDA to the display object, as described in the following example. However, you have to leave the design mode first.
-
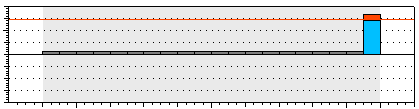
Bar chart as profile display - Signals were assigned to only the upper limit and the last bar.
-
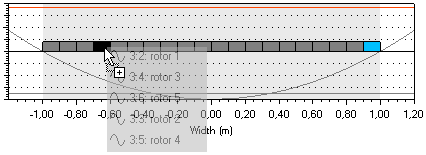
When dragging the mouse across the display, the bar size and profile, and the limits are becoming visible. The object underneath the mouse pointer will be highlighted. In this example, 5 analog signals, which were selected in the signal tree before, will be dragged onto the display.
-
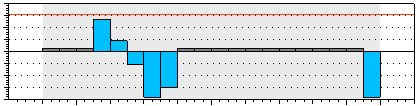
After the signals have been dropped, all five analog signals will be added progressively. If one or several vector signals are dragged onto the display, all bars are highlighted and the first vector signal will be assigned to the bar.
-
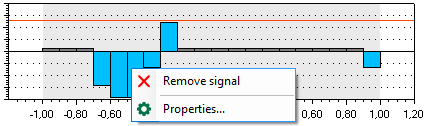
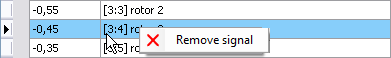
A signal can be removed by right clicking on the desired element. This is even possible in the signal table of the properties.
-
Besides the single bars, a signal from the signal tree can also be assigned to limit lines and profiles via drag & drop.


In the following example a signal was assigned to a bar.
