For every SINUMERIK-Xplorer interface there is a table available in the I/O Manager which shows the status of each connection. Each row represents one connection.
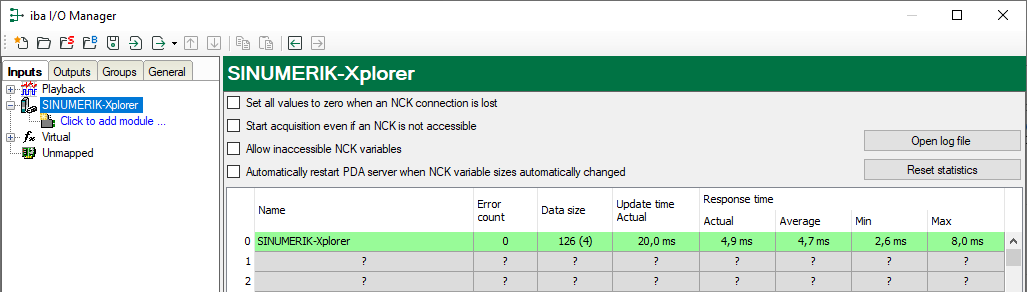
The columns display different values, depending on the type of the interface. The connected target systems (NCKs) are identified by their name or IP address in the first (left) column.
The table shows the cycle times and error counters of the different connections during the data acquisition. In the Data size column, the number of requested bytes and the number of Request telegrams in brackets are displayed for support purposes.
Click the <Reset counters> button to reset the error counters and the calculation of the response times.
Additional information is provided by the background color of the table rows:
|
Color |
Meaning |
|---|---|
|
Green |
The connection is OK and the data are read. |
|
Orange |
The connection is OK, however the data update is slower than the configured update time. |
|
Red |
The connection has failed. |
|
Grey |
No connection configured. |