On the X axis there are various buttons for the navigation:
|
|
Zoom function |
|
|
Scroll |
|
|
Jump to a date |
If the HD trend graph is used in ibaQPanel, the events can be displayed as text channels together with both time- and length-based HD trend graphs.
For further information, see chapter ibaHD-Server in ibaQPanel.
Zoom function
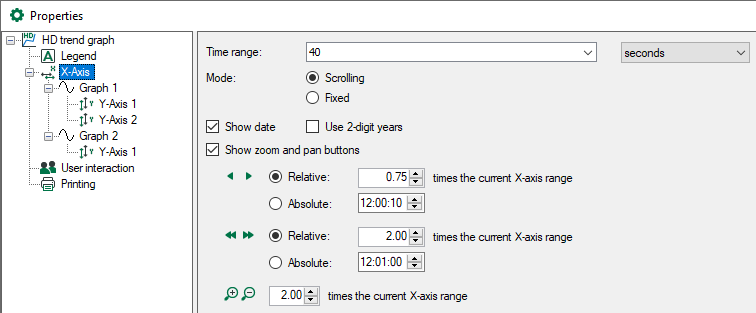
In the pause mode, the <+>-button enlarges the center of the X axis and in the live mode the last part of the X axis. The <-> button reduces accordingly. The default value of the zoom factor is 2. This means if the section of the X axis is enlarged, it is half as large as the original section, if it is reduced, the section of the X axis is twice as large as the original section. The zoom factor can be modified via the X axis properties.
Scroll
|
|
Scrolls in large steps to the left, starting from the current position |
|
|
Scrolls in small steps to the left, starting from the current position |
|
|
Scrolls in small steps to the right, starting from the current position |
|
|
Scrolls in large steps to the right, starting from the current position |
The step can be set via the X axis properties. The default setting for little steps is relative 0.75 and for large steps relative 2. Alternatively, the step can be set as absolute value in hh:mm:ss time units for time-based values and in meter for length-based values.
Example: If the X axis indicates a range of 100 s and if the time stamp goes to 10:00:00, a small step jumps to the left by 75 s on 09:58:45 and a large step to the left by 200 s on 09:56:40.
The functions zoom and scroll can be carried out with the help of the keyboard:
|
Button |
Key |
Description |
|---|---|---|
|
|
<+> |
enlarging |
|
|
<–> |
reducing |
|
|
Page up |
small step to the right (only in pause mode) |
|
|
No key function |
large step to the right (only in pause mode) |
|
|
Page down |
small step to the left |
|
|
No key function |
large step to the left |
Jump to a date
Clicking the button ![]() opens a calendar where you can enter a date and time on second basis.
opens a calendar where you can enter a date and time on second basis.
With a click on the arrow to the right, the display of the trend graph jumps to this time point.
This function is also available on length-based HD trend graphs because the time stamp is always stored along with the length-based data.
Other documentation |
|
|---|---|
|
Please take further information about the settings of the display e. g. scaling the Y axis, using the markers etc. from the manual or the online help of ibaPDA. |
|


