By setting the client options, you can determine how events are show on the connected client computers in the event display and which commands are sent to the trend displays when the event occurs.
These settings are generally applicable preferences. If the corresponding settings, such as color settings for events, were changed locally on a client computer, then these are dominant over the values specified in the client options.
These settings also always refer to the event(s) marked on the left in the event tree.
Event table
Set the row style
Select the font style as well as the background and text color here. Every event message is then shown exactly that way, unless other settings were locally set on a client.
Trend graph commands
Set displayed time span around event
Here you can set how big the time period before and after an event should be, which should be shown in the trend view after the occurrence of the event time.
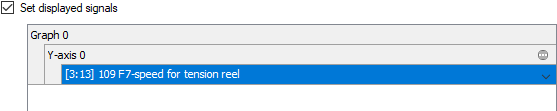
Set displayed signals
If you enable this option and have specified signals for display, then only the curves of the specified signals are shown in the trend view when the event occurs.
Signals that could be seen in the trend view before the event occurred are removed and replaced by the signals from this setting.
This process cannot be automatically undone in order to restore the old state. The previous signals could only be reloaded into the trend display with another event.
When determining the signals, in addition to the signal selection you also have the ability to decide whether the signals should be shown on one or on different Y-axes or whether a new trend graph should appear in the trend view.
The buttons have the following meaning:
 |
Add signal |
 |
Add signal on new Y-axis |
 |
Add signal in new graph |
|
Remove signal |
Proceed as follows:
-
Enable the option Set displayed signals.
-
If the list field is still empty, click on the <Add signal> button. A curve plane and a Y-axis will be created in the list field. Under the Y-axis the signal tree opens from which you can now select the desired signal.
-
If you click on the icon on the Y-axis plane,
 you can specify additional settings of the Y-axis, such as the scaling.
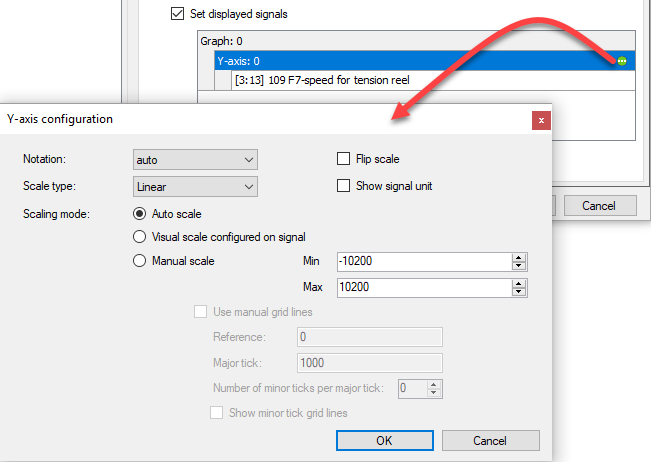
-
If you want to add additional signals that are to be displayed on the same Y-axis and in the same trend graph, simply click on <Add signal.>
-
If you want to display a signal in the same trend graph with a different Y-axis, for example due to a different physical unit or a different scaling, then click on the button Add signal or new axis.
 . Another Y-axis plane is added in the list field under which you can select signals
again.
. Another Y-axis plane is added in the list field under which you can select signals
again.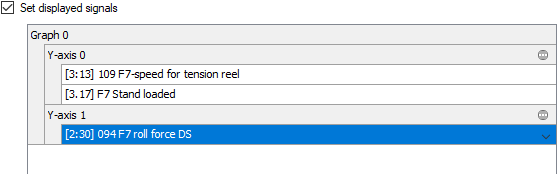
-
If you want to add a new trend graph in the trend view, then click on the button Add signal on new graph
 . A new curve plane with a new Y-axis is created in the list field under which you
can add signals again.
. A new curve plane with a new Y-axis is created in the list field under which you
can add signals again.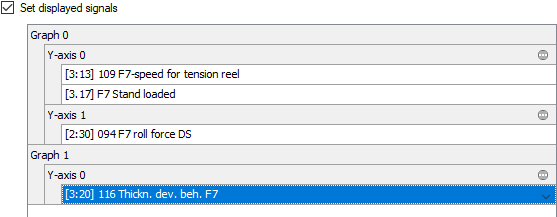
-
If you want to delete a signal, a Y-axis or a curve, select the respective plane and click on the button
 .
. -
Exit the dialog with <OK>.


If an event occurs as described in this example, the trend display would look like this:
