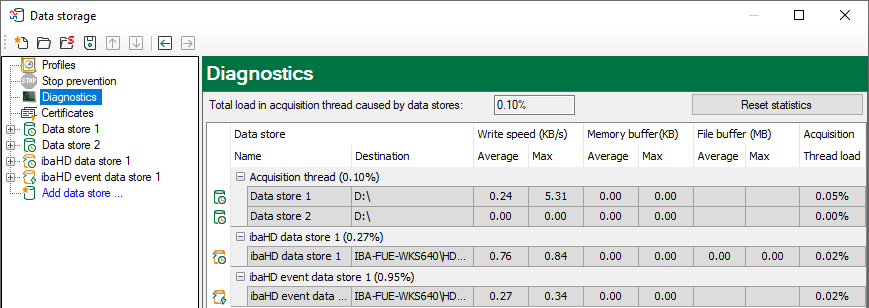
In the configuration dialog for the data store a sub-tree “Diagnostics” is available. In this overview you can find information about the performance of any configured data store.
The lines with the HD data stores (time-, length- and event-based) show the writing speed that is used to write the data on ibaHD-Server.
The columns Memory buffer (MB) show how much data is buffered in the memory buffer in ibaPDA. The columns File buffer (MB) show how much data is buffered in the file buffer. These values should usually be around zero. If this connection to the ibaHD-Server is interrupted, the values for the buffered data will ascend.
In the column “Thread Load” the partial processing time will be displayed, that is used for the creation of the data to be written on the HD server. These values already contain the run length encoding for time-based stores, event trigger calculation for event-based stores and the calculation of the length-based data for length-based stores.
Other documentation |
|
|---|---|
|
You can find information regarding the store types that are no HD stores in the ibaPDA manual. |
|
