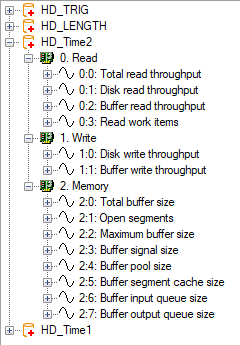
In addition to the configured measuring data, ibaHD-Server records a series of specific diagnosis data for every HD store in a special diagnosis memory. The data provide information about the performance of the system during writing and reading access as well as about the use of the memory and the buffer.
These data can be viewed with the ibaPDA client (starting from ibaHD-Server version 1.4.1). Principally, in case of problems, they should supply the support with specific information about the activity of ibaHD-Server at the moment of the failure. These are constant date sets that are always stored time-based.
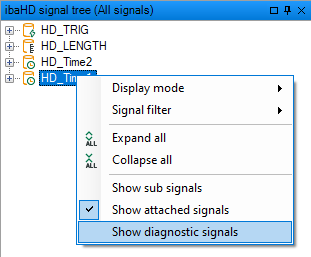
To enable the display of the diagnosis data, perform a right mouse click with depressed <Shift> key in the HD signal tree window. The context menu now contains (contrary to the simple right mouse click) the options “Show diagnostic signals” and “Show attached signals”, see also chapter Show appended signals.
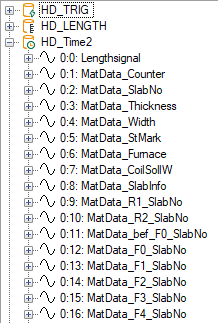
If you enable this option, the measured signals in HD signal tree will be replaced by diagnostic signals. Example in the following figure :HD signal tree with measured signals (left side) or diagnostic signals (right side).
You can now drag the diagnosis signals and drop them into a (time-based) HD trend graph curve as usual for display purposes.
The following limitations apply to the diagnostic signals:
-
-
Diagnostic signals are sampled and stored with a rate of 1 Hz
-
The max. limit of the memory for the cleanup strategy is 512 MB
-
The max. recording time for the cleanup strategy is 6 months
-


