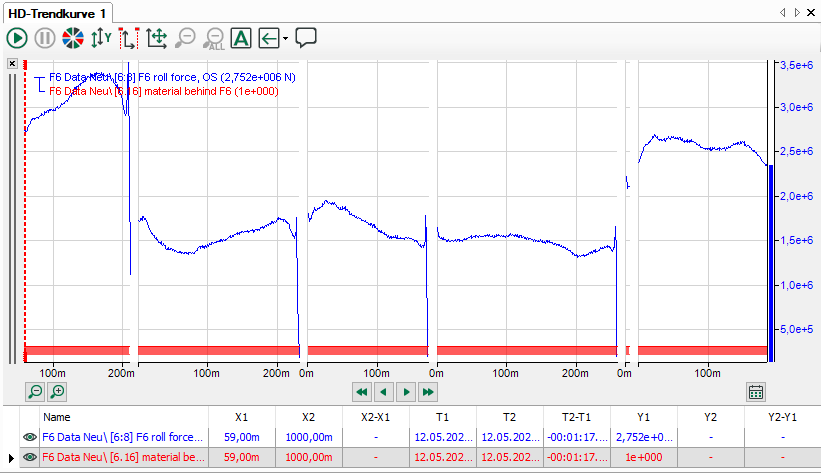
Basically the buttons for the time- and length-based HD trend graphs are similar to each other.
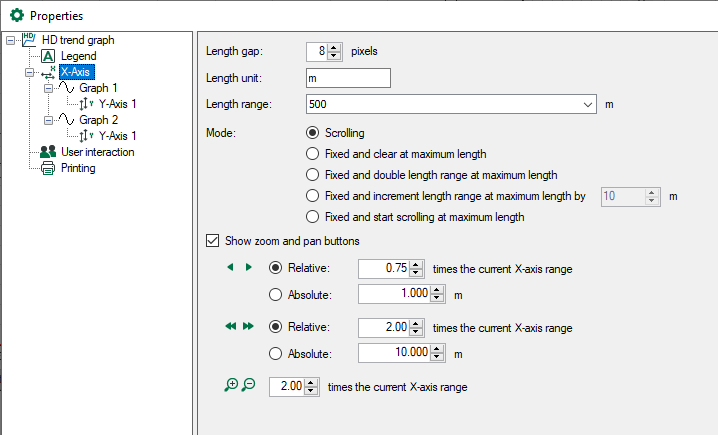
In principle, the difference is that the x-axis is labeled with length units at the length-based display and the buttons for scrolling work with length steps. However, there is no “endless” x-scale but consecutive sections where the length scale always increases from 0 to a maximum value. Between these sections no storage takes place and a gap, that always remains the same, will be entered to get an optical separation. Therefore you will find according settings in the properties dialog.
Length gap
Set the size of the required gap between two curve sections in pixels here.
Length unit
Enter the length unit to label the x-axis here.
Length range
The length range can be entered as a fixed value. You can also select an analog signal that specifies the length range dynamically. The value has to be considered as a maximum value for the length scale on the x-axis.
In practical applications, however, the current value can differ from that as the length of the length axis also depends on the length base for the storage. A length-based HD trend graph can display maximum 50,000 samples per signal. If a length base of 1 mm was selected in the storage profile, for example, the length range will automatically be limited to 50 m - no matter which value you set here.
Mode
|
Mode |
Behavior |
|---|---|
|
Scrolling |
The length value determines the visible range of the base axis. The base axis starts at 0 and scrolls in the specified direction until length value is reset. Then a gap follows which indicates the length reset and the scrolling starts again as soon as the length value increases. |
|
Fixed and clear at maximum length |
The fixed base axis shows a scale from 0 to length range value. The graph shifts in the specified direction. The graph is cleared when the length signal is reset. If the graph reaches end of scale before length reset (length range is smaller than the actual length), the base axis shifts for another length range. |
|
Fixed and double length range at maximum length |
The fixed base axis shows a scale from 0 to length range value. The graph shifts in the specified direction. The graph is cleared when the length signal is reset. If the graph reaches end of scale before length reset (length range is smaller than the actual length) the base axis is rescaled to double the length range. The graph moves further by the specified amount. If the end of the scale is reached before the length reset, the scale is extended again by the specified amount. |
|
Fixed and increment length range at maximum length by... |
The fixed base axis shows a scale from 0 to length range value. The graph shifts in the specified direction. The graph is cleared when the length signal is reset. If the graph reaches end of scale before length reset (length range is less than the actual length) the base axis is extended by the specified amount. The graph continues shifting to the middle of the base axis. When the end of scale is reached again before length reset, the scale is doubled again (4 times the original length range). |
|
Fixed and start scrolling at maximum length |
The fixed base axis shows a scale from 0 to length range value. The graph shifts in the specified direction. The graph is cleared when the length signal is reset. If the graph reaches end of scale before length reset (length range is smaller than the actual length), the base axis moves with scrolling speed. |
Buttons for zooming and scrollling
Functions and properties correspond to those of the time-based HD trend graph.
Signal/marker table
Compared to the time-based HD trend graph, there are 3 more columns in the signal table of the length-based HD trend graph.
Signal/marker table
Signal table with marker values, positions and distances:
|
Column |
Live mode |
Pause mode |
|---|---|---|
|
X1 |
Current position/product length |
Position/product length at marker 1 |
|
X2 |
- |
Position/product length at marker 2 |
|
X2-X1 |
- |
Length difference between marker 1 and 2 |
|
T1 |
Current time stamp |
Time stamp at marker 1 |
|
T2-T1 |
- |
Time span between T1 and T2, including the gaps |
|
T2 |
- |
Timestamp at marker 2 |
|
Y1 |
- |
Sample at marker 1 |
|
Y2 |
- |
Sample at marker 2 |
|
Y2-Y1 |
- |
Sample difference between marker 1 and 2 |
Tip |
|
|---|---|
|
If you place a marker on the gap between the graphs, the maximum value of the previous measurement will be displayed as x-value. This is, for example, how the total product length can be determined very easily. |
|

