In an HD trend graph view, time- or length-based HD data can be displayed. Both signal types cannot be shown together in one view. Furthermore, separated displays must also be used for every measuring location at length-based HD data.
The signals of different measuring locations cannot be displayed together in one HD trend view.
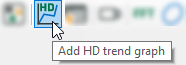
An HD trend graph will be opened when you click in the ibaPDA client
-
on the icon in the toolbar and then drag signals with the mouse out of the HD signal tree (time- or length based) and drop them into the trend graph via Drag & Drop.
-
double click on a signal in a HD signal tree (time- or length-based).
-
or drag an event from the HD signal tree (time- or length based) and drop it on the empty work space of the ibaPDA client.

The display of the historical trend graph is the same as that of the normal trend graph with the difference that the data comes from the ibaHD-Server and not from the ibaPDA server. In case of time based storage, the signal can be displayed during the whole recording period.
Open HD trend graph in ibaAnalyzer
If the HD trend graph is paused, you can open the displayed time range in ibaAnalyzer. To do this, open the context menu and select Open with ibaAnalyzer.
