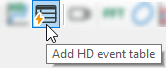
An event table will be opened if you click in the ibaPDA client
-
on the icon in the toolbar
-
or make a double click on an event in the HD signal tree.


Toolbar
The toolbar of the event table contains the following control elements:
|
|
Starts live alarm stream. |
|
Starts the live display of the event table. All triggered live events are immediately displayed in the event table. |
|
|
Stops the live display of the event table. It is now possible to mark individual signals in the event table. |
|
|
Displays the number of events in a time range. Select the events of the event table and the time range in the dialog window. The table that appears contains a list with the number of events. |
|
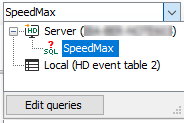 |
Selection list for selecting the desired event query. If you expand the list field, you can see all existing event queries and select the one you want. If you click on the <Edit queries> button, the configuration dialog for queries opens. You can then edit existing queries or create new ones. |
|
|
Executes the event query that was selected in the selection list. |
|
Updates the display according to the query executed. |
|
|
Automatic acknowledgement of all incoming events |
|
|
Display/hide signal tree |
|
|
Automatically marks the last line added. |
|
|
|
Copies the line(s) selected in the event list to the clipboard. Only possible in pause mode. |
|
Exports the line(s) selected in the event list to an Excel or text file. Only possible in pause mode. |
|
|
|
Acknowledges all events displayed in the event table. |
Status bar
The status row is on the lower border of the event table. It gives information about the event queries carried out (e.g. status of the running query, number of the events, error messages) and if a filter is currently active.
Sorting
The event table can be sorted ascending or descending in every column. Click on the header of the column which you want to use as sorting criterion. The displayed downwards pointing arrow symbolizes the descending sorting order. The arrow pointing upwards symbolizes the ascending sorting order.
In an event table, the "Time" column in descending order is selected as default setting. Hence, the most recent event is always on top.
Acknowledgment
Every single event can be acknowledged via the control box in the "Ack" column. Clicking
on the button![]() will acknowledge all of the events displayed at once.
will acknowledge all of the events displayed at once.
Note |
|
|---|---|
|
The acknowledgment of an event cannot be reversed. |
|
Filter line
The upper row in the event table is for filtering the table. In all columns except for Trigger and Priority you filter according to the entered string. It is not possible to use placeholders. In the Time column, filtering is possible with the operators <, >, <= and >=. Select a search operation using the <ABC> or <=> button. Then enter the search term or a value.

In the Trigger column, the following filter allocations are possible:
 No filtering active.
 Only incoming events are displayed.
 Only outgoing events are displayed.
In the Ack column, the following filter allocations are possible:
 No filtering active.
 Only not acknowledged events are displayed.
 Only acknowledged events are displayed.
Note |
|
|---|---|
|
As soon as a filter is set, a filter symbol is displayed in the column header and the filter row is highlighted in green. The set filter is displayed below the table. It is also possible to enter a filter in a field of the filter line and to hide the associated column. So you can, for example, display only incoming messages without displaying the Trigger column. The filter for the respective column can be edited and deleted by clicking on the filter symbol. |
|
A detailed description of the filter functions can be found in the appendix, chapter Advanced filter in tables.