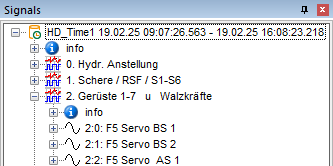
The ibaAnalyzer signal tree displays the result of an HD query for a period of time like a data file.
The signals in the query result are treated in the same way as the signals from a normal data file.
You can also apply analyses that were created using a data file to HD query results and vice versa. You also have the option of exporting query results as a DAT file.
Other documentation |
|
|---|---|
|
Further information can be found in the ibaAnalyzer documentation part 2, chapter Opening data files. |
|
Depending on the options selected under HD Server in the graph setup or preferences, you can query the maxima and minima of the aggregated values of a signal as subchannels, see Subchannels min/max. This can be particularly interesting when selecting a large timebase or data from a higher aggregation level. So-called outliers are then easier to recognize.
Results of a query with a signal condition are displayed as a file group, as there are usually several results. By default, one line is displayed for each search result in the drop-down list, even if several HD stores are involved.
If you want the results being listed separated by HD stores in the file group field, you have to enable the option Show query results over different stores as separate entries in the preferences, HD Server tab.

