If you use the zoom function in ibaAnalyzer, the data is not reloaded, unlike with the HD trend graph in ibaPDA. The number of samples and therefore the resolution of the signal curve remains unchanged.
If you have executed an HD query with a timebase of 1 min, for example, because the time range was correspondingly large, then the distance of 1 min is also kept when zooming in. Zooming in therefore does not create any new information.
For a better data resolution, you can therefore perform a so-called drill-down in the zoomed-in display.
During a drill-down, the time range and timebase are recalculated according to the set zoom level and the data is requested from the HD server accordingly.
To perform a drill-down, click on the corresponding icon in the menu bar or the command in the View menu:


The command is only available in the menu bar and menu bar if you have previously zoomed in. If you want to perform another drill-down, you must zoom in further.
Undo drill-down
You can undo the drill-down operations step by step. The icon in the menu bar and the Undo drill-down command are only available if you have performed at least one drill-down.

You can only apply drill-down operations to HD queries whose signals are displayed in the currently selected graph or are used in an expression that is displayed in the currently selected graph.
Accordingly, you can only undo a drill-down for HD queries to which the displayed signals or expressions are related.
Behavior in the signal tree
If you perform a drill-down, a modified HD query is executed and the original HD query in the signal tree is overwritten. The HD query generated by a drill-down has the following properties:
-
Same HD server and same HD store
-
Time range corresponding to the zoomed X-axis range
-
A preferred timebase, calculated according to the following formula:

Example
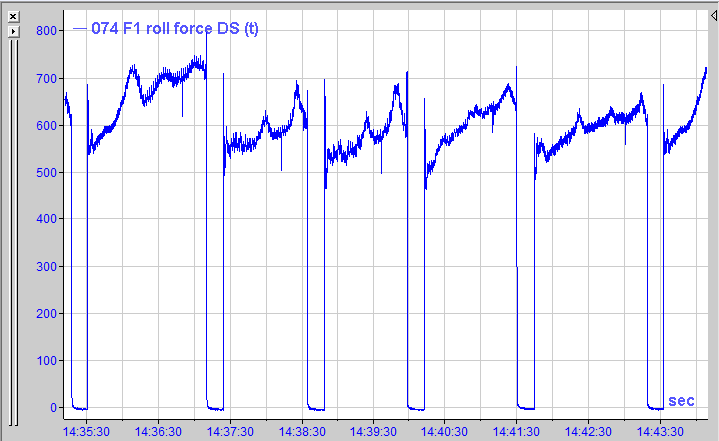
An HD query over a time range of 2 days and 8 hours with a timebase of 30 s provides the following image after zooming in to a time range of only 8 min:
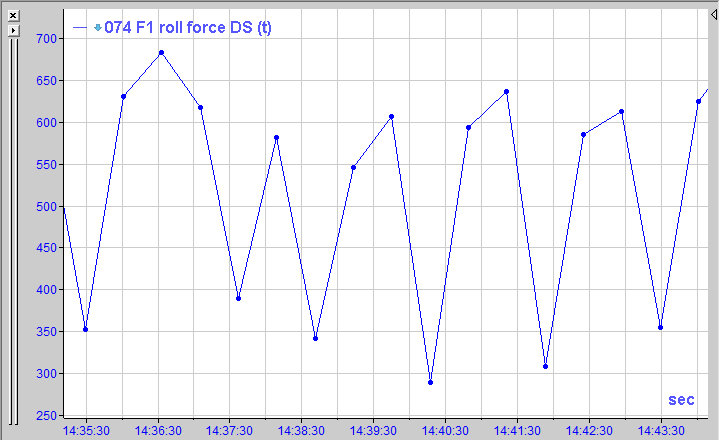
Only the execution of a drill-down provides sufficient information for a meaningful curve. The zoom factor remains unchanged.