The Line chart tile type enables the visualization of length-based and time-based signals from DAT files.

-
Under Signals – Available Signals, tap on the Group option.
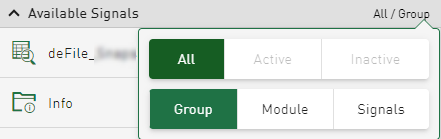
The list of available signals from each DAT file is displayed by default in a module-based tree structure.
The measured signals are shown in the module view with the module number and module name. The assigned analog and digital signals are listed under the modules with the corresponding signal numbers and signal names. Analog and digital signals are identified by different icons, see Symbols in the software.
-
Tap on the respective signal in the tree structure to enable the visualization in the diagram.
The visualization of length-based signals in the line diagram always starts at 0 m.
If the DAT files are recorded with ibaQDR, then the signals are generally shown as length-based signals. In the Options area, a function that is only available for QDR files is available that switches the currently selected signals to the time-based view. A chart can also display signals with different timebases.
Note

Time-based and length-based signals cannot be visualized together in a view. If, for example, a length-based signal is already selected, this view is cleared as soon as a time-based signal is selected.
-
Select the columns from the database index table.
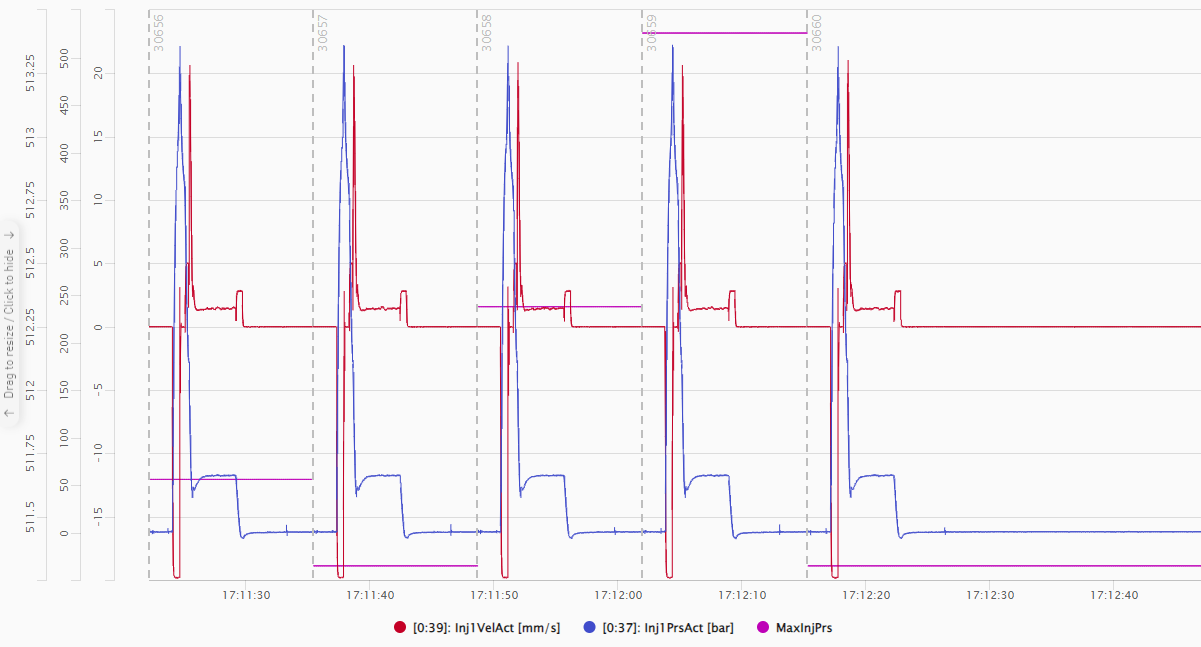
In addition to the name for the currently displayed measurement signals, additional values are shown in the legend, such as material designations. The signal values are displayed either in appended or stacked view.
In the appended view, the file idents are shown together with the beginning and end marking of the DAT file.
Tip

Proven method
Under Optionen select Stacked view. Then select your ident table column. Together with the signal name, the identification value of the currently displayed DAT file signals is shown in the legend.
-
Optionally select a different signal view under Options, see Options.

