In Diagrams (e.g.line charts) showing signals from time-based or event-based stores and allowing interaction with ibaAnalyzer, you can display markers and place them freely.. For further analysis, you can transfer the time range between the markers directly into ibaAnalyzer.

-
Tab on the button
 .
.The signal values of the respective marker position are displayed in labeling fields.
-
To position the markers manually and interactively, drag the label field for the respective marker to any position in the diagram.
To position the markers exactly, tap the button
and select Set marker position.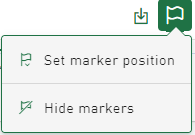
An input dialog shows the current time position of the two markers.
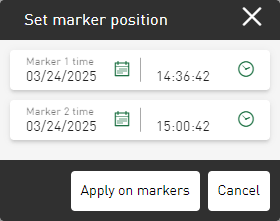
Adjust the values and confirm your entry with <Apply on markers>.
-
To hide the markers again, tap the
button again and select Hide markers.


Zoom behavior of markers
The markers remain at the selected position when zooming until they are hidden. If a marker is placed outside the currently displayed time range, a transparent arrow indicates the direction in which the marker is positioned.

Open time range for analysis in ibaAnalyzer
If the markers are set, you can transfer the time range between the markers to ibaAnalyzer for detailed analysis. Tapping on the download icon in the header of the diagram tile shows the following options:

Open the area between the markers in ibaAnalyzer
Selecting this option generates an HDQ file for download, which opens the time range between the markers in ibaAnalyzer. The HDQ file takes the connection information of the ibaHD-Server from the data source configuration and the times for start and stop from the current marker positions. If the ibaHD-Server is accessible via ibaAnalyzer, the HDQ file displays the time range selected in ibaDaVIS.
Open the area between the markers with analysis
Selecting this option generates an PDC file for download, which opens the time range between the markers in ibaAnalyzer. The analysis file applies parts of the PDC file directly to the HD data. To do this, you must first add the corresponding analysis in the data source configuration of ibaDaVIS in the Analysis tab for the HD stores, see Analysis tab.