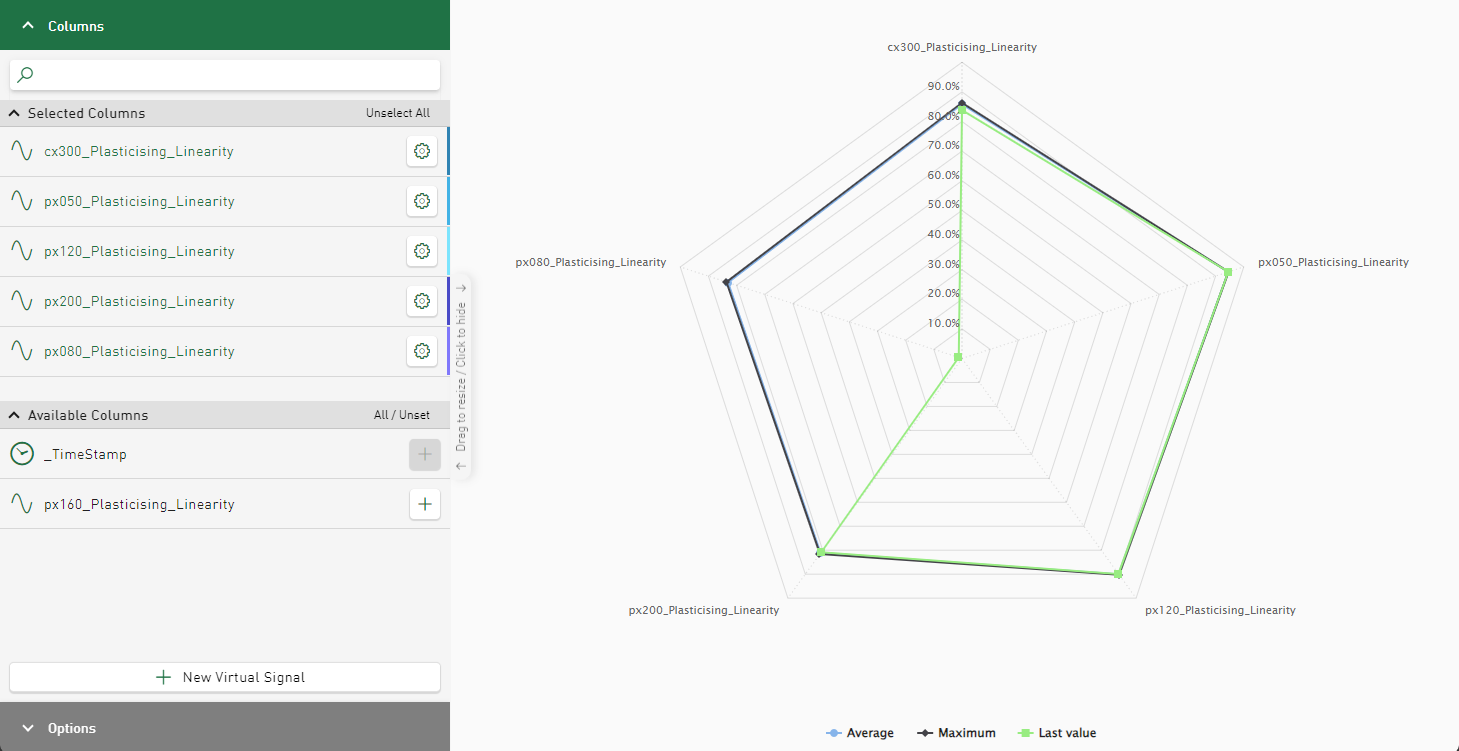
You can use the Radar chart tile type to display data from database tables, ibaHD-Servers or DAT files. Use the radar chart, for example, to display statistical data such as maximum, minimum and average values of several selected columns or signals.
Options
Aggregators
Selection of the statistical values to be displayed for the signals or columns.
Display legend
Displays the name of the aggregators shown.
