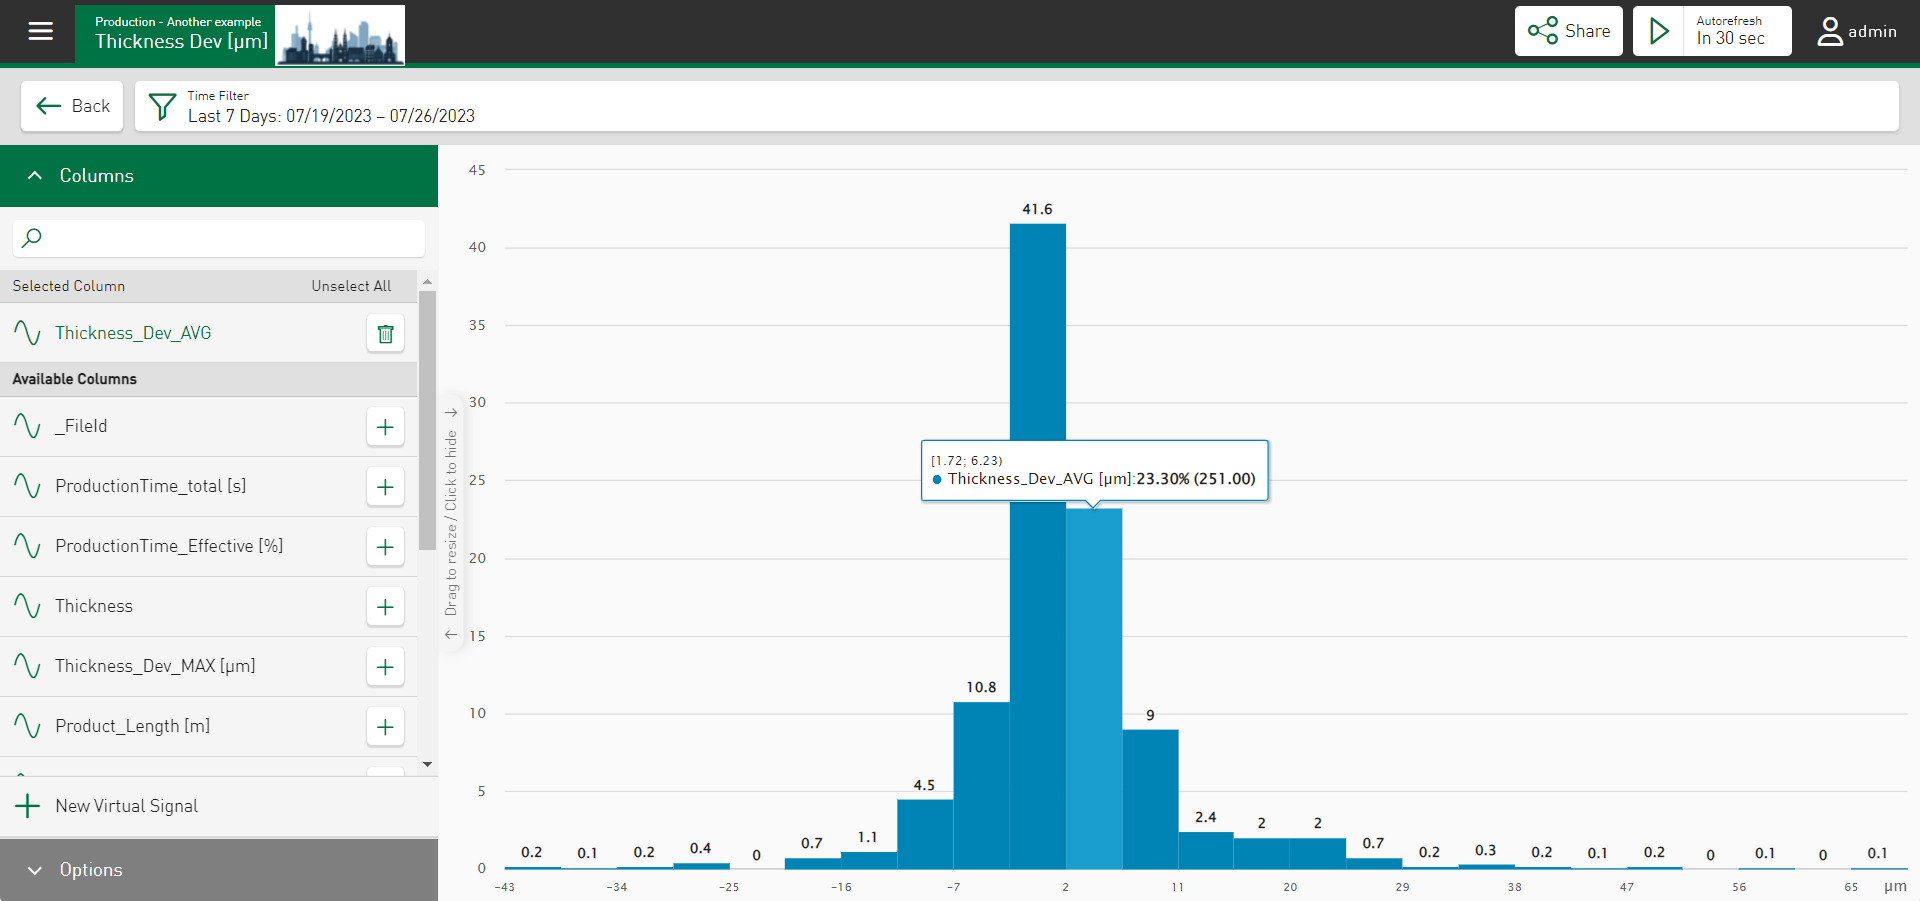
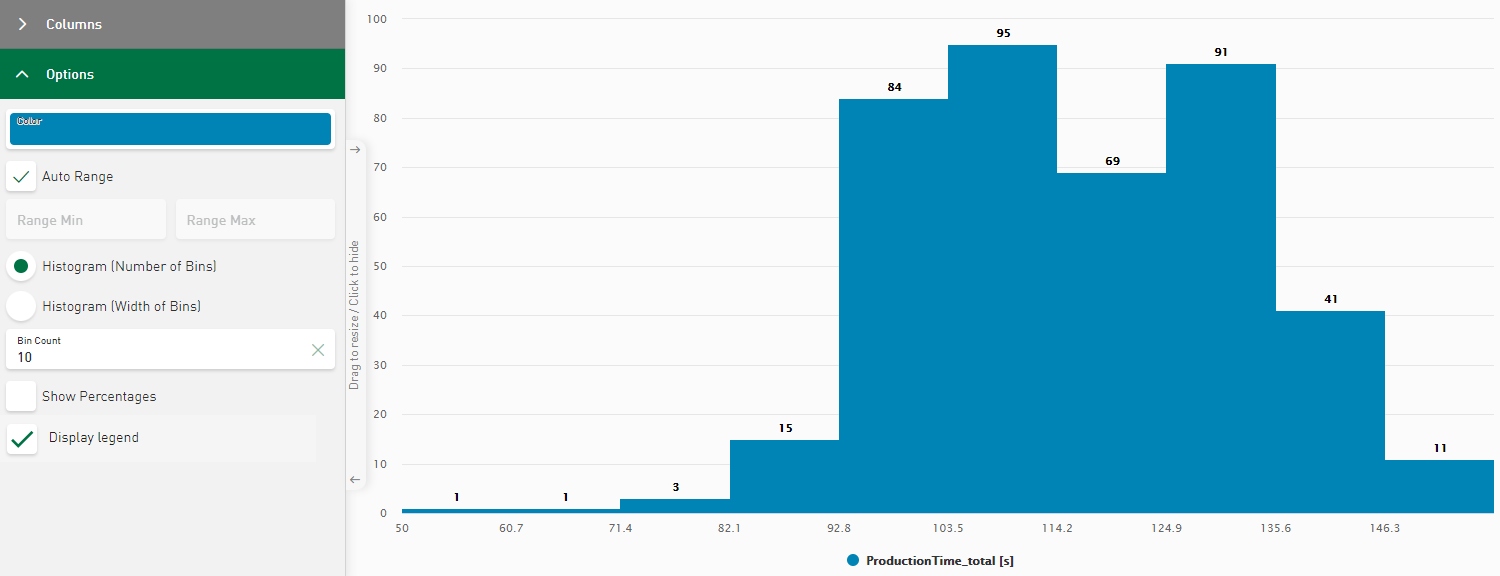
The Histogram is suitable for displaying the value distribution of a characteristic value. The value distribution can be displayed as an absolute value or as a percentage. A histogram can be used, for example, to make statements about process stability or deviations.
Columns
In the Columns section a signal or characteristic value for the display can be selected. You can only select one signal. If a second signal is selected, the previously selected one will be removed.
Options
Color
You can assign any color to each value using the color field, see Color selection in tiles.
Auto Range
Display of the entire value range
You can also manually define the range by specifying a minimum and maximum value.
Histogram (Number of Bins)
The division can be made based on the number of bins. For this, enter the desired number in the Bin Count field. The width of the columns is then automatically calculated from the number of bins. The larger the number, the finer the subdivision.
Histogram (Width of Bins)
The division can also be made based on the width of a bin. For this, enter the desired width in the Bin Width field. The number of bins (number of bars displayed) is calculated from the bin width and the value range of the currently collected data.
Show Percentages
The value distribution of a bin is displayed directly above the column. You can change from absolute values to percentages.
Display legend
Shows the name of the displayed signal

