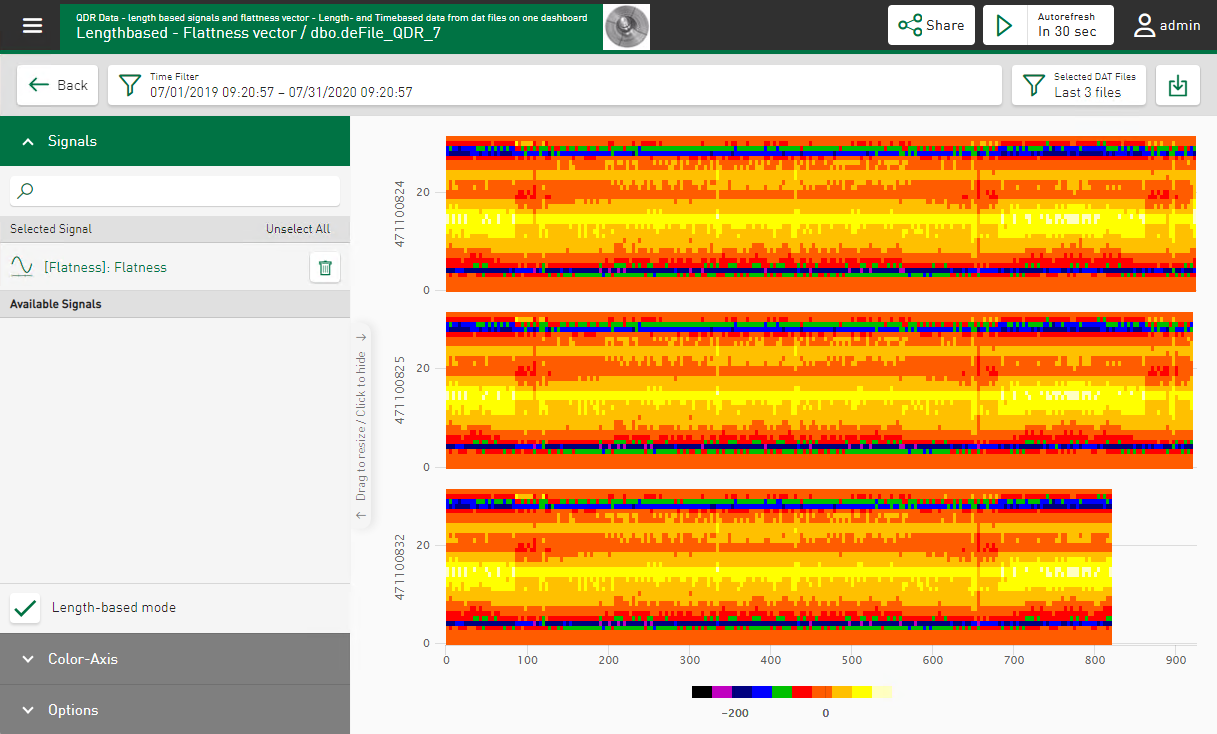
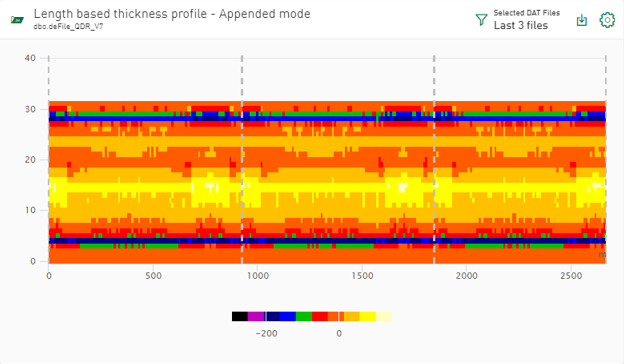
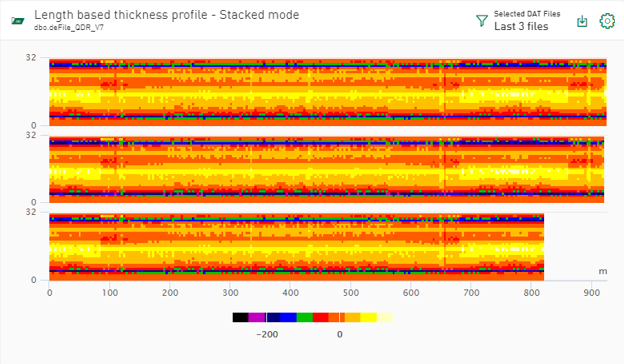
Signals from DAT files that are combined as a vector group can be visualized as a Heatmap. This is useful for signals from flatness or profile inspection systems. You can apply the Heatmap to time-based and length-based vectors.
Signals
Select the vector group from the signal list. The Heatmap visualizes the signal vector using the ibaAnalyzer and ibaQPanel default colors for 2D plots.
You can also display vector data from measured values tables. For this purpose, you have to extract signals that are assigned to the vector into the database using the DB functionality of ibaAnalyzer.
As in the other DAT file views, it is possible to select a file ident column from the data source. The current file ident column is displayed before the signal name of the visualized vector group name.
Color Axis
Auto Scale
After deselecting automatic scaling, you can specify minimum and maximum values for analysis.
Automatic coloring
The default color setting is the same as in ibaAnalyzer. It is possible to change the color range by disabling the checkbox. To change the color, tap on a color field and select one of the default colors directly from the editing window that appears. You can also use the Slider or enter an RGB value/HEX code/HSL color code to make a color selection. The value in the Z-axis is colored according to the resulting gradient.
Relative limits/Absolute limits
Colors and limits for the color selection can be precisely specified and set. The
basic setting specifies the color ranges with the relevant equal distribution in the
set value range. Using the buttons ![]() and
and ![]() , you can add or delete value ranges You can define the colors for the range using
the color field. The ranges are initially set as percentage value ranges via the Relative limits option. You can switch to absolute values. The currently set range limits can then
be converted in relation to the current minimal and maximum values.
, you can add or delete value ranges You can define the colors for the range using
the color field. The ranges are initially set as percentage value ranges via the Relative limits option. You can switch to absolute values. The currently set range limits can then
be converted in relation to the current minimal and maximum values.
Smooth transitions between colors
Select this option if you find the color transitions between value ranges too abrupt. When enabled, the color transitions occur in gradations due to an optical softening effect in the graphics. The following example shows the same values without (figure left) and with (figure right) smooth color transitions:
Options
Number of ranges in X direction/Number of zones in Y direction:
You can influence the display accuracy and display speed with these 2 parameters. Signals grouped as a vector are distributed evenly in the Y direction over the number of zones, initially 25 zones. Along the X-axis, the measured values are initially distributed over 250 areas. A higher number of zones and areas increases the display accuracy, but reduces the display speed.
Appended/Stacked view:
You can choose between 2 different display formats.
In the appended view, you also have the choice between the display on the X-axis synchronized with the recorded time (Appended view - recorded time) and a relative time axis (Appended view - relative time).
Display event filter
To limit the visualized range from the selected DAT files, you can use an event filter that has already been set, see Using the DAT file event filter.
Display legend
Shows the name of the displayed signal
Download DAT files and analysis for data source
Under Download DAT as ZIP, downloads are available in ZIP format for selected DAT files. If an analysis is configured for the data source of the currently displayed values, you can download the DAT files together with the analysis as a PDC (Process Data Container) file, see Analysis tab.
Markers in HD stores and interaction with ibaAnalyzer
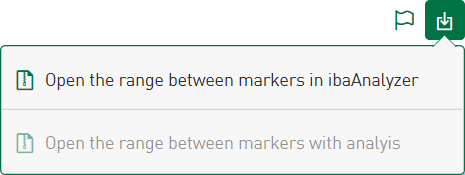
If the Heatmap visualizes time-based HD data, you can place markers using the ![]() button, which opens a specific time range directly in ibaAnalyzer. As with the tile type Line chart, the interaction with ibaAnalyzer starts via a context menu which you enable by tapping on the download icon. In the
download, you can thus include both a file containing the connection information to
HD store and time range, and an analysis file which opens HD data and the analysis
together in ibaAnalyzer. For additional information, please see Using markers in HD stores.
button, which opens a specific time range directly in ibaAnalyzer. As with the tile type Line chart, the interaction with ibaAnalyzer starts via a context menu which you enable by tapping on the download icon. In the
download, you can thus include both a file containing the connection information to
HD store and time range, and an analysis file which opens HD data and the analysis
together in ibaAnalyzer. For additional information, please see Using markers in HD stores.


