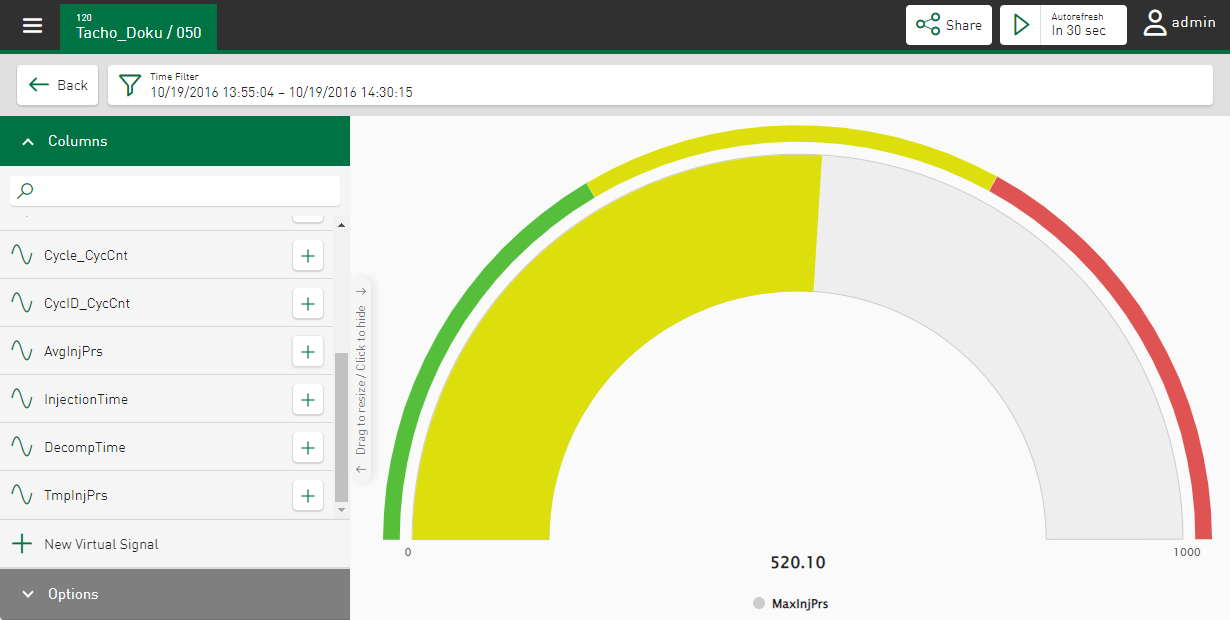
Using the Gauge, you can display individual values. For a select value series, you can use statistical features to calculate and display a value, such as the average value of a parameter over a selected time period. The colored range always starts with the value “0” to make deviations more easily visible.
You can select constant values or signals or even virtual signals as minimum or maximum values. In the gauge, the minimum and maximum values of all configured parameters appear as the minimum and maximum of the spectrum arc, and the currently calculated value for the selected signal.
Signals
Selection of the signal or value series to be displayed. You can only select one signal. The displayed range is set from 0 to 1000 by default, but you can adjust this in the Options section.
Options
Aggregation
Aggregation function to be applied to the selected signal or value series:
-
Count: Quantity of values of the selected value series
-
Sum: Sum of values of the selected value series
-
Average: Average of values of the selected value series
-
Minimum: Minimum value of the selected value series
-
Maximum: Maximum value of the selected value series
-
Last value: Parameter display of the last acquired value
-
StdDev: Standard deviation for the selected value series
-
Median: Median of the selected value series
Min/Max
Setting the displayed range
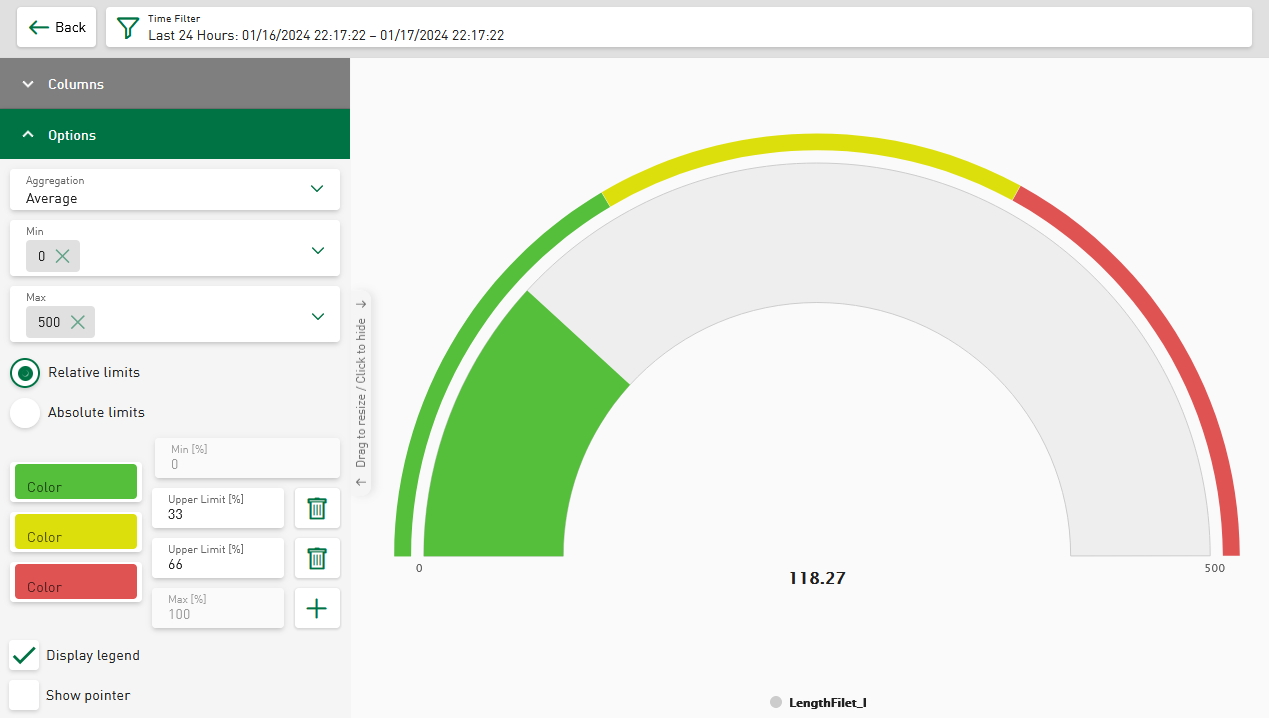
The display color changes from green to yellow to red, depending on whether the displayed value is in the range of the minimum, in the middle or at the maximum.
Relative limits/Absolute limits
You can define the colors and limits for the color change individually. Relative limits are set as percentage values by default. With the buttons <Add Value> and ![]() , you can add or delete value ranges You can define the colors for the range using
the color field, see also Color selection in tiles.
, you can add or delete value ranges You can define the colors for the range using
the color field, see also Color selection in tiles.
If you select the Absolute limits option, the currently set range limits are converted into absolute values in relation to the current minimum and maximum values and displayed.
You can define a maximum of 7 value ranges. The representation of the color bar begins with the value “0.”
Display legend
Shows the name of the displayed signal
Show pointer
Instead of the default display, which resembles a fill level, a pointer shows the current value. And a scale for the displayed range appears.

