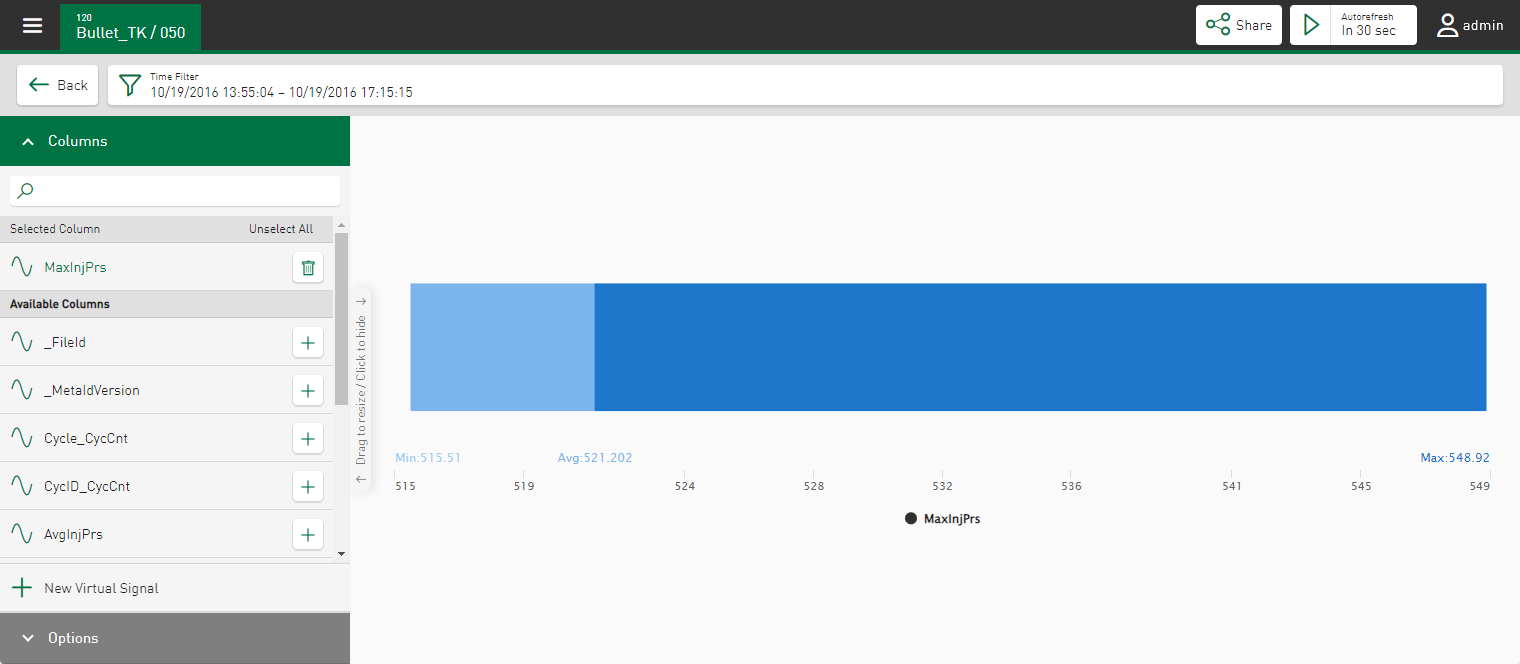
With the Bullet graph, several statistical characteristic values of a value series can be displayed. The minimum, average and maximum values from the selected column as well as the last registered value from the value range currently defined via the time filter are displayed.
Columns
In the Columns section, select the signal or a value series for the display. You can only select one signal/value series. The range is set from 0 to 1000 by default.
Options
Auto Scale
If activated, the entire value range is displayed. If you disable this option, you can enter a minimum and maximum value to set the scaling range.
Last value
Here you can activate the parameter display of the last recorded value. This parameter is marked by a black line that runs vertically through the value range at the corresponding position.
Display legend
Shows the name of the displayed signal

