In time-based diagrams, you can set a zoom filter to display a selected area in higher resolution.
Use zoom filter in line chart
-
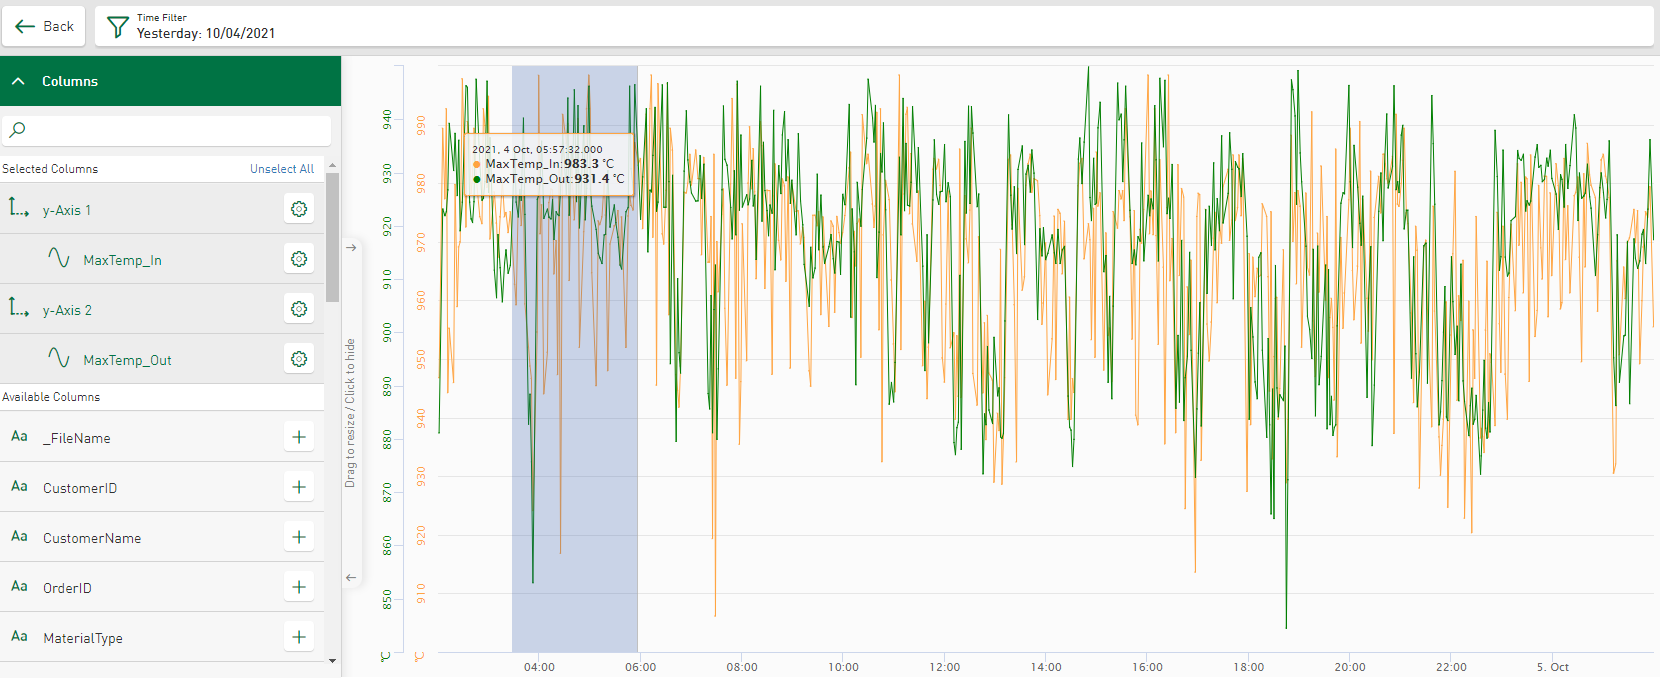
In the tile view or in the dashboard view, drag a rectangle directly onto the tile diagram with the mouse button held down.
Dashboard view:
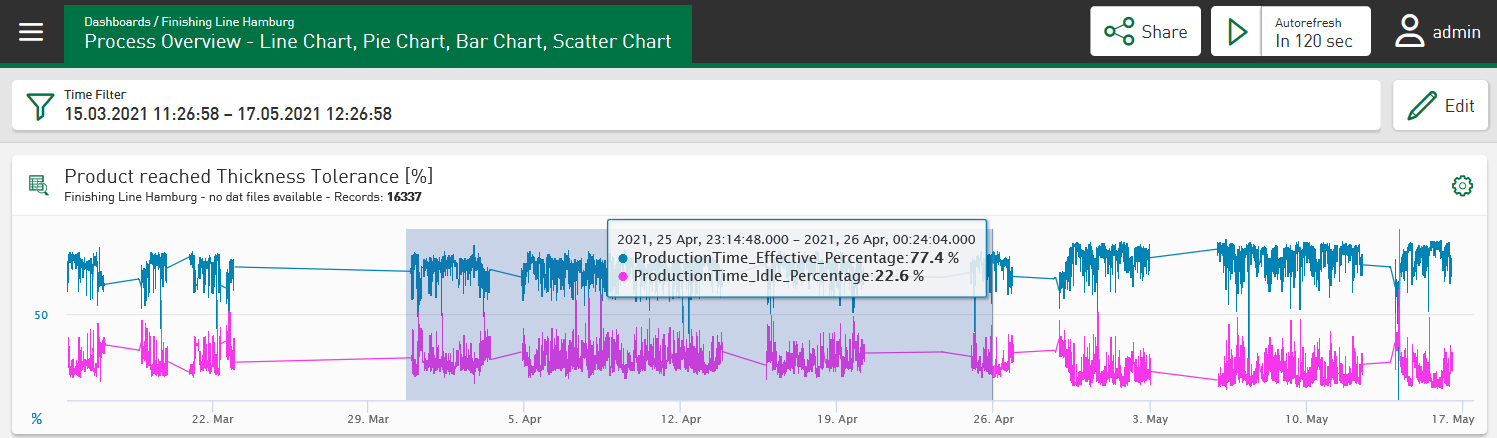
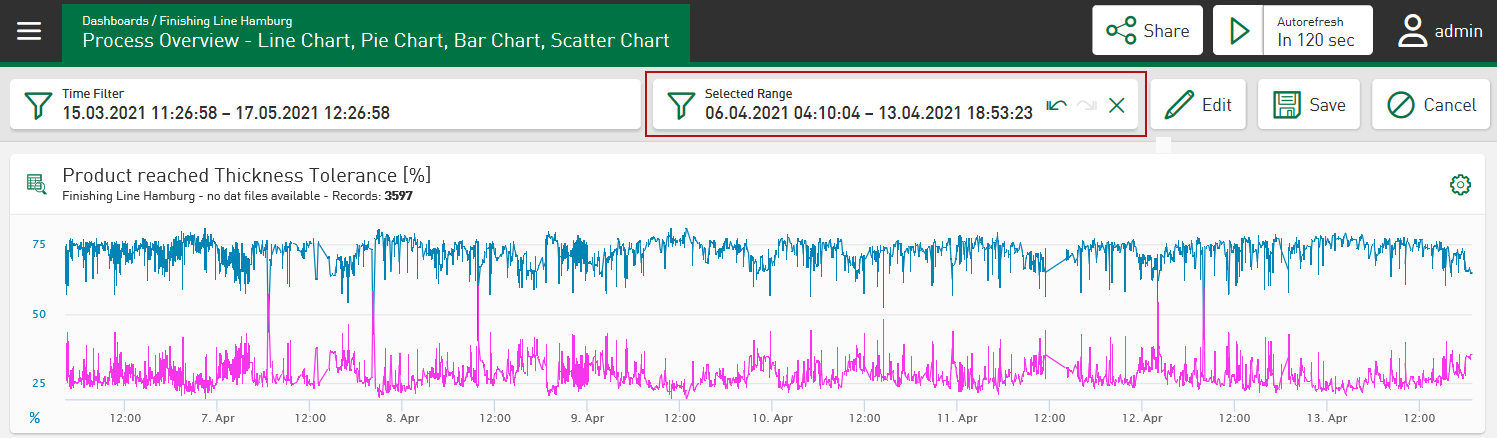
The zoomed time range is displayed in a new Selected Range filter and applied to the entire dashboard.
Dashboard view:
-
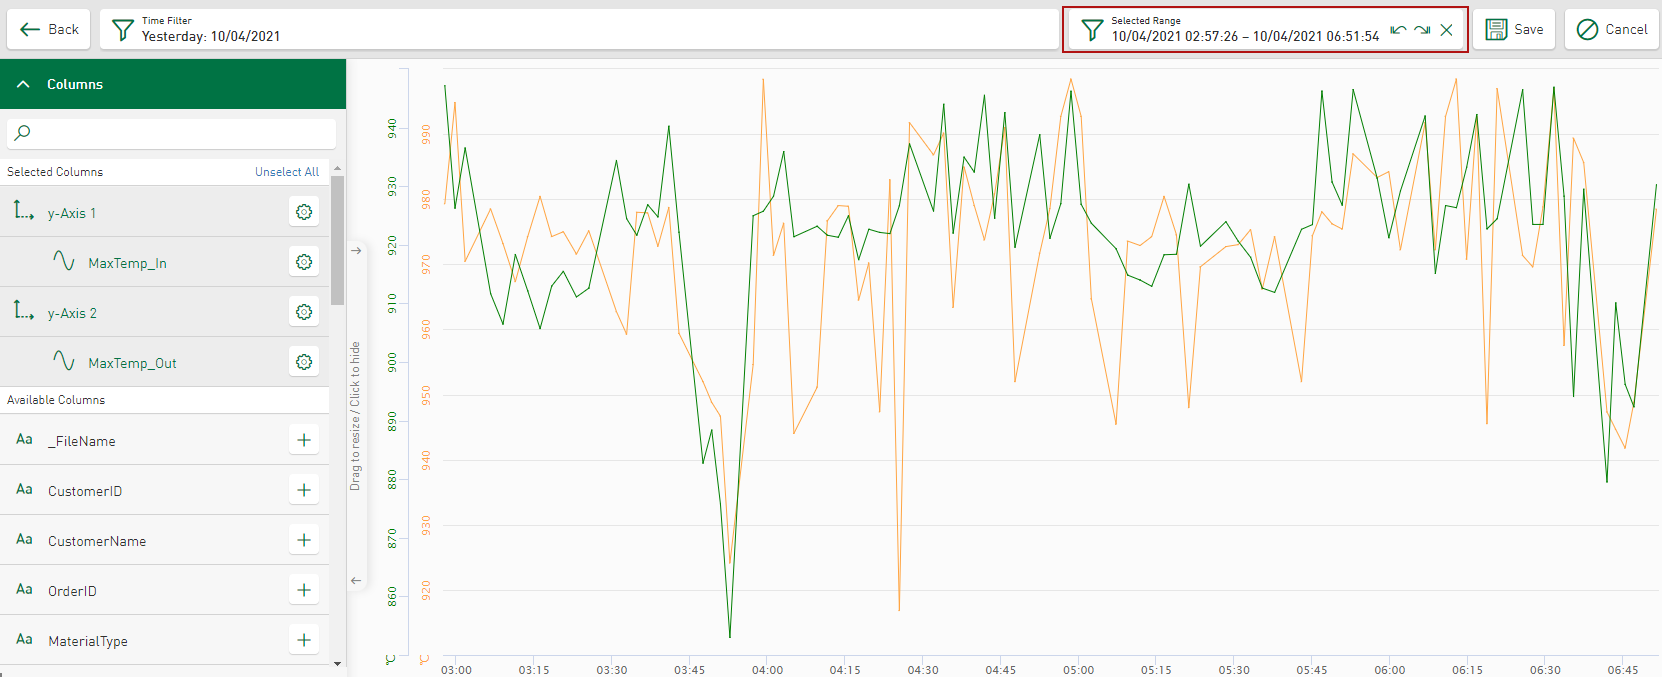
Optionally zoom further into the area.
The filter area is updated in the Selected Range field.
The
 button appears. You can use this to jump forwards and backwards in equal zoom steps.


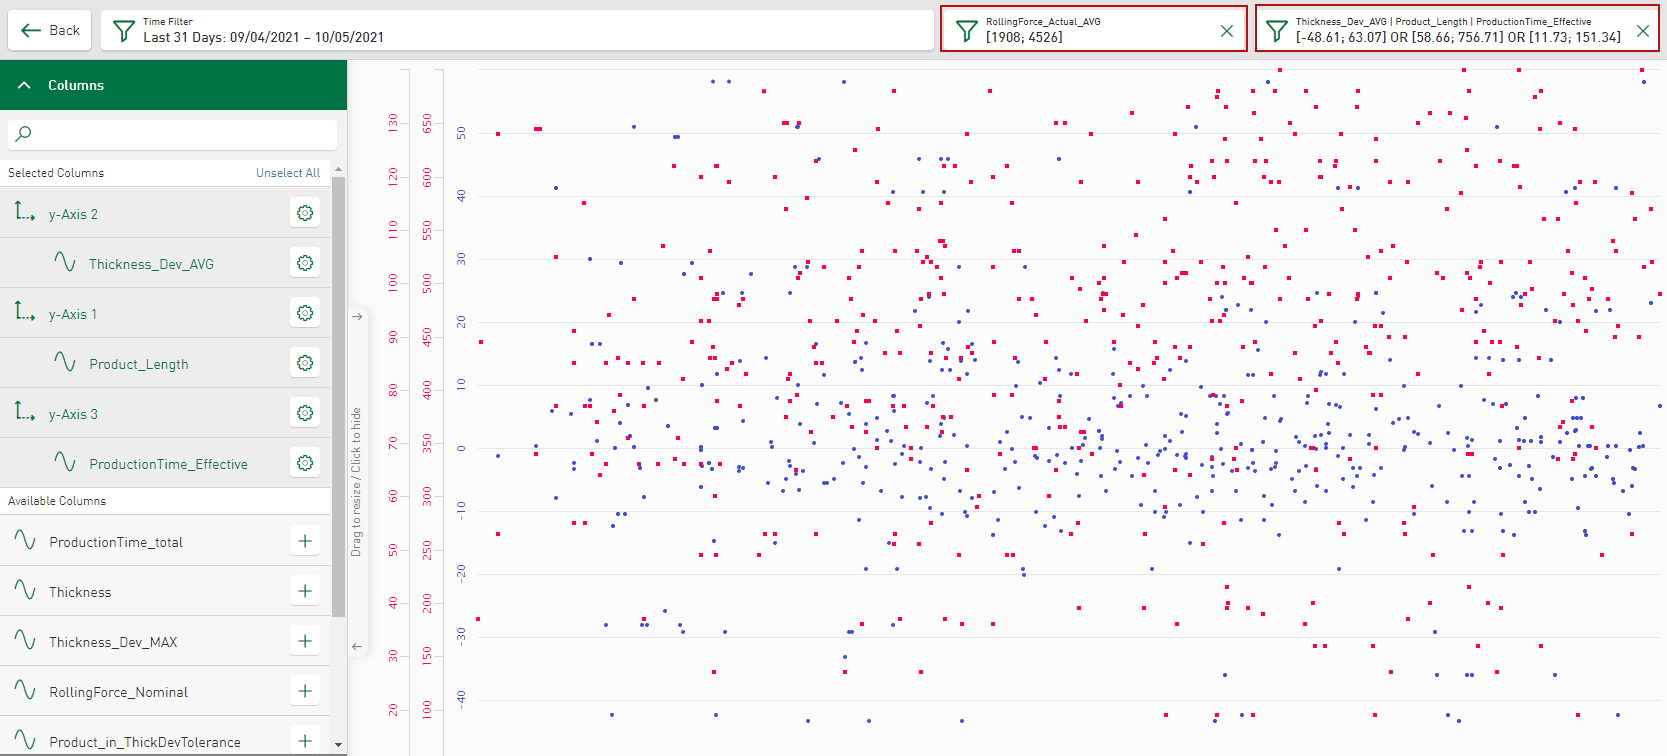
Use zoom filter in scatter chart
-
In the tile view or in the dashboard view, drag a rectangle directly onto the tile diagram with the mouse button held down.
The zoomed area is displayed and the fields corresponding to the filter selection are shown.
If several values are selected for display in the Y-axis, the areas filtered together by zooming are displayed together in a filter cell.
Dashboard view:
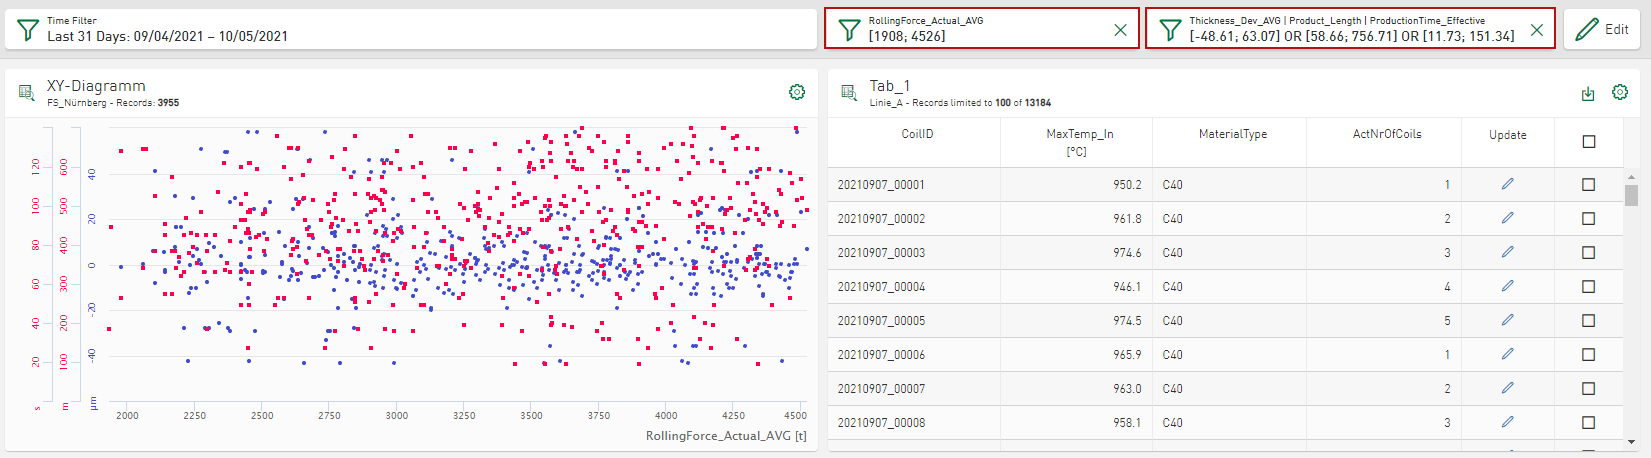
-
To define the filter more precisely, tap the filter button
 .
.A menu opens in which the selected value range is displayed and can be edited.


Note |
|
|---|---|
|
A maximum of 2000 data points are displayed. If more than 2000 data points are to be displayed, these are reduced by an algorithm. The range limits in which the points are summarized are then displayed in the tooltip. The maximum number of points displayed can be defined individually, see Configuration file. |
|