In the pie chart, you can filter according to the underlying groupings (circle segments).
-
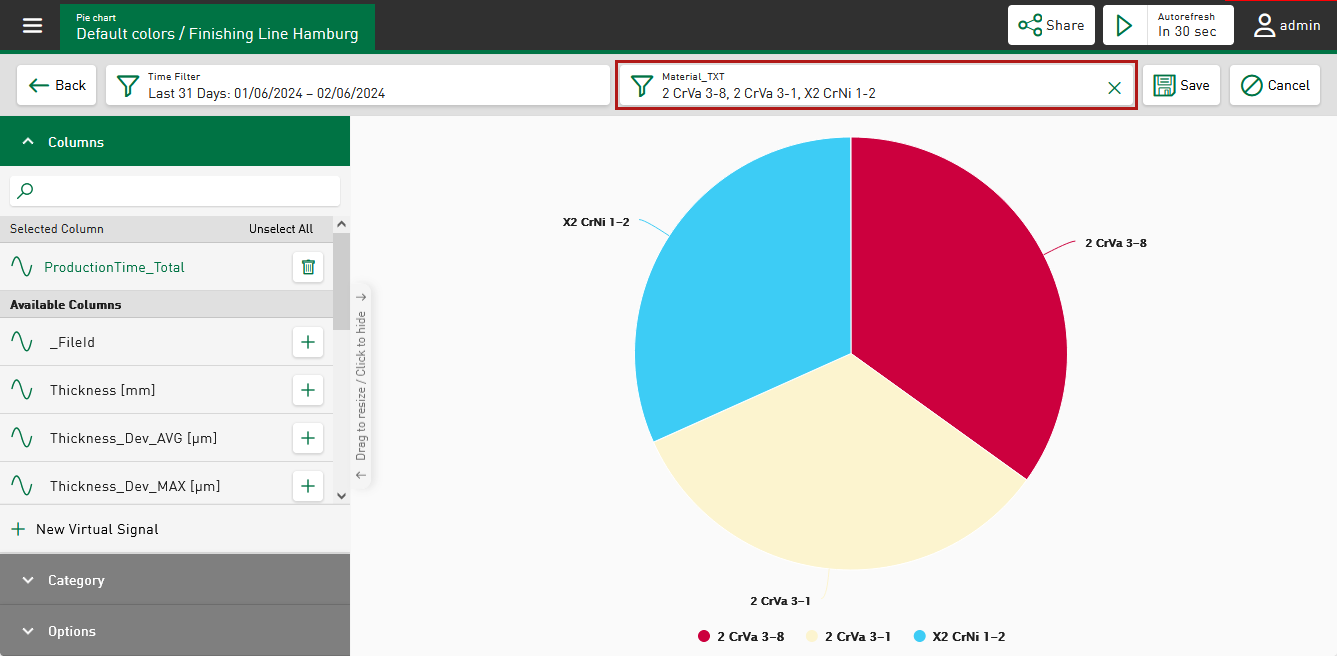
To set the filter, tap on one or more circle segments.
The appearance changes accordingly. The filtered materials appear in a field above the display.
-
To change the filter values, tap on the filter symbol
 .
.A dialog opens in which you can adjust the values. Current filter values are displayed in a list and can be enabled or disabled using the relevant option. Disabled values are no longer mapped; however, they are not removed from the list and can be accessed at any time.
-
To permanently remove values from the filter, tap the
 symbol.

Dashboard view

The filtered categories appear in a field above the dashboard. As in the tile view, you can also set the filter by tapping on one or more circle segments (left image below). The pie chart only shows the filtered segments (bottom right image). The display of all tiles changes accordingly. Here too, you can use the filter icon to open a dialog to adjust the filters.
 |
 |