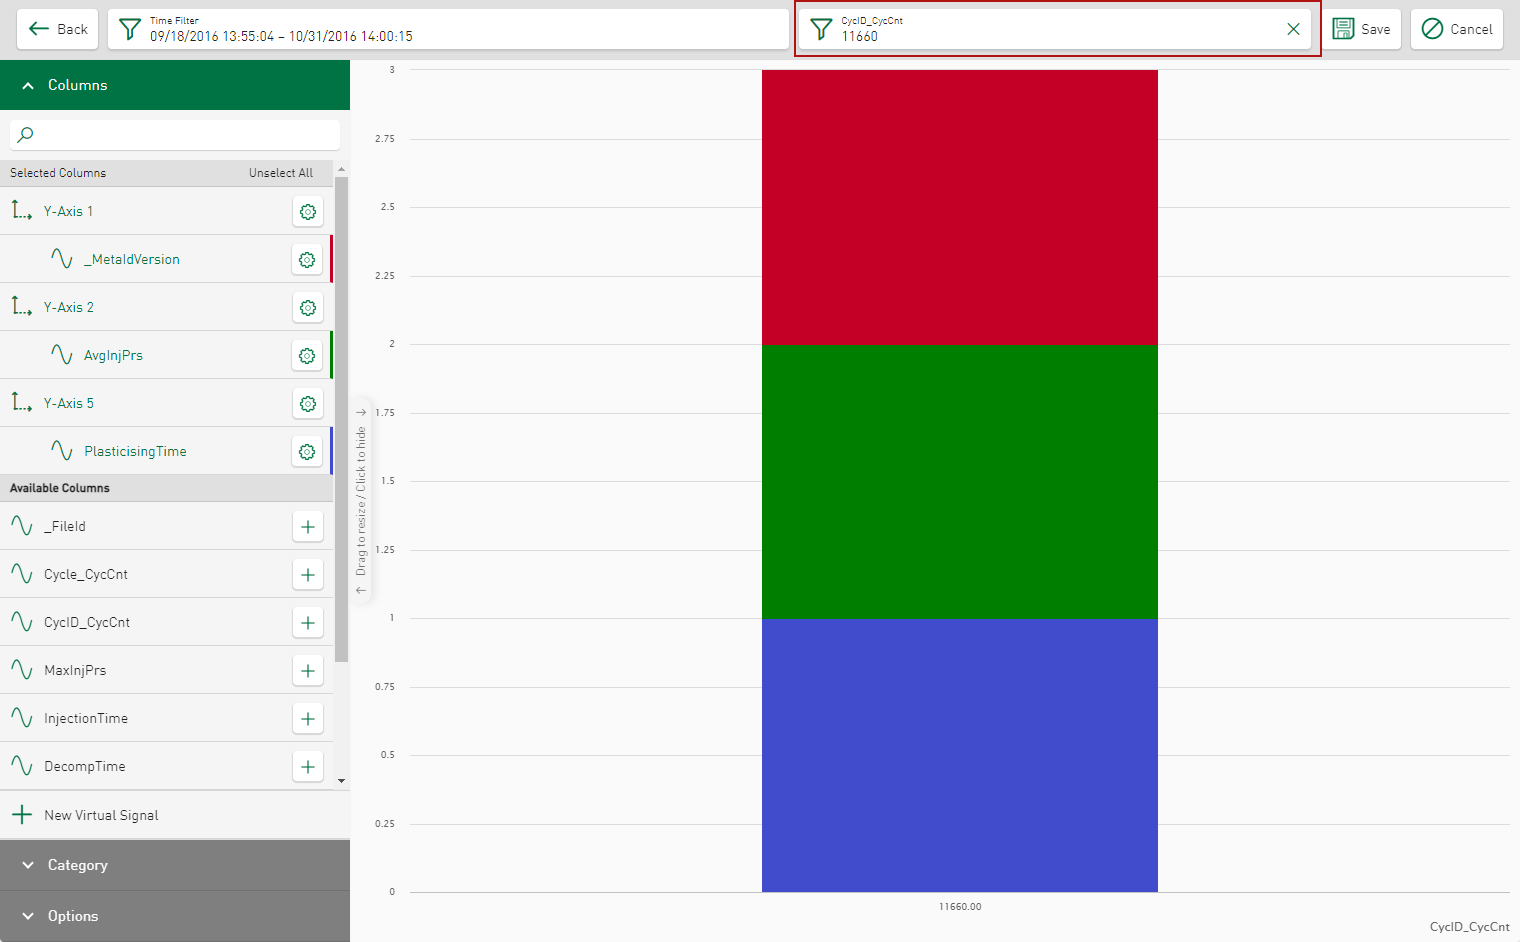
In Bar chart tiles, you can filter using the time range and the bar filter.
-
To set the bar filter, tap on the bar.
The display changes accordingly, the filtered area appears in a field above the display.
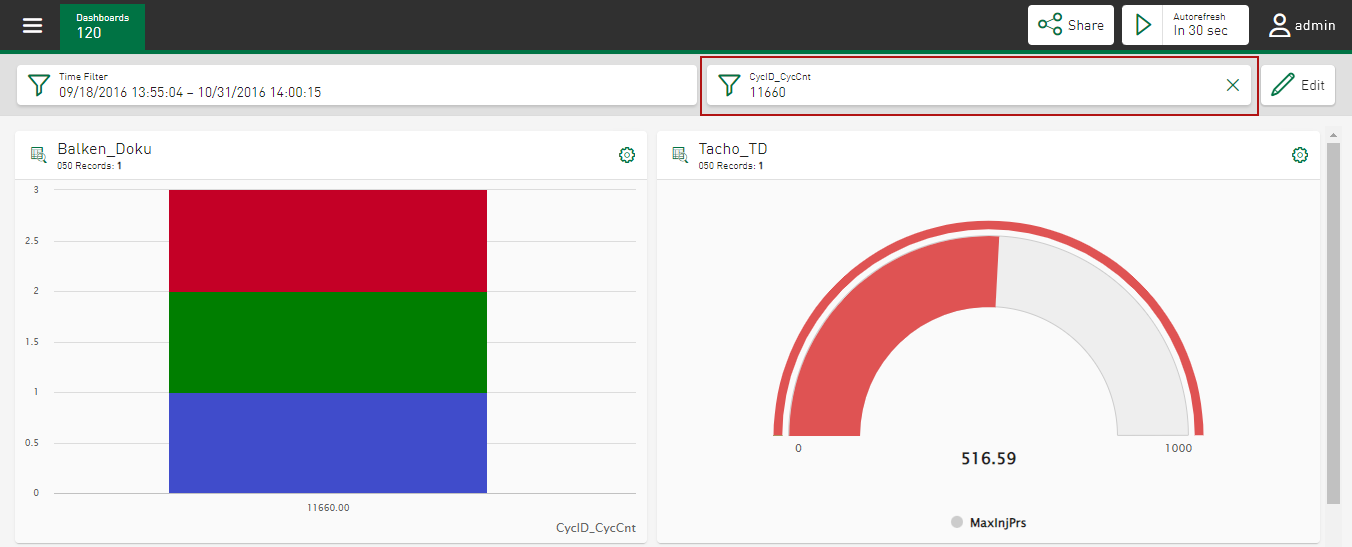
Dashboard view:
-
To change the filter values, tap on the filter symbol
 .
.A dialog opens. Current filter values are displayed in a list and can be enabled or disabled using the relevant option. Disabled values are no longer mapped; however, they are not removed from the list and can be accessed at any time.
-
To add further filter criteria, tap the <Add Value> button.
-
To permanently remove values from the filter, tap the
 icon.
icon.

