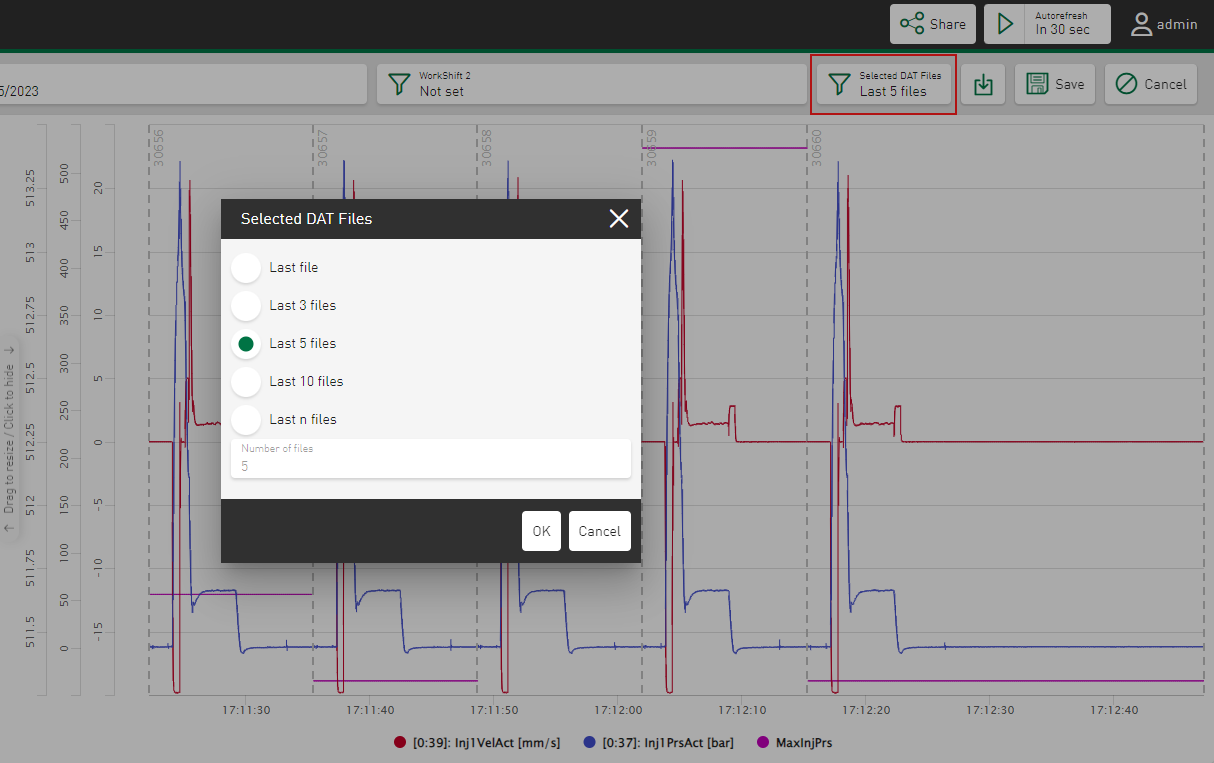
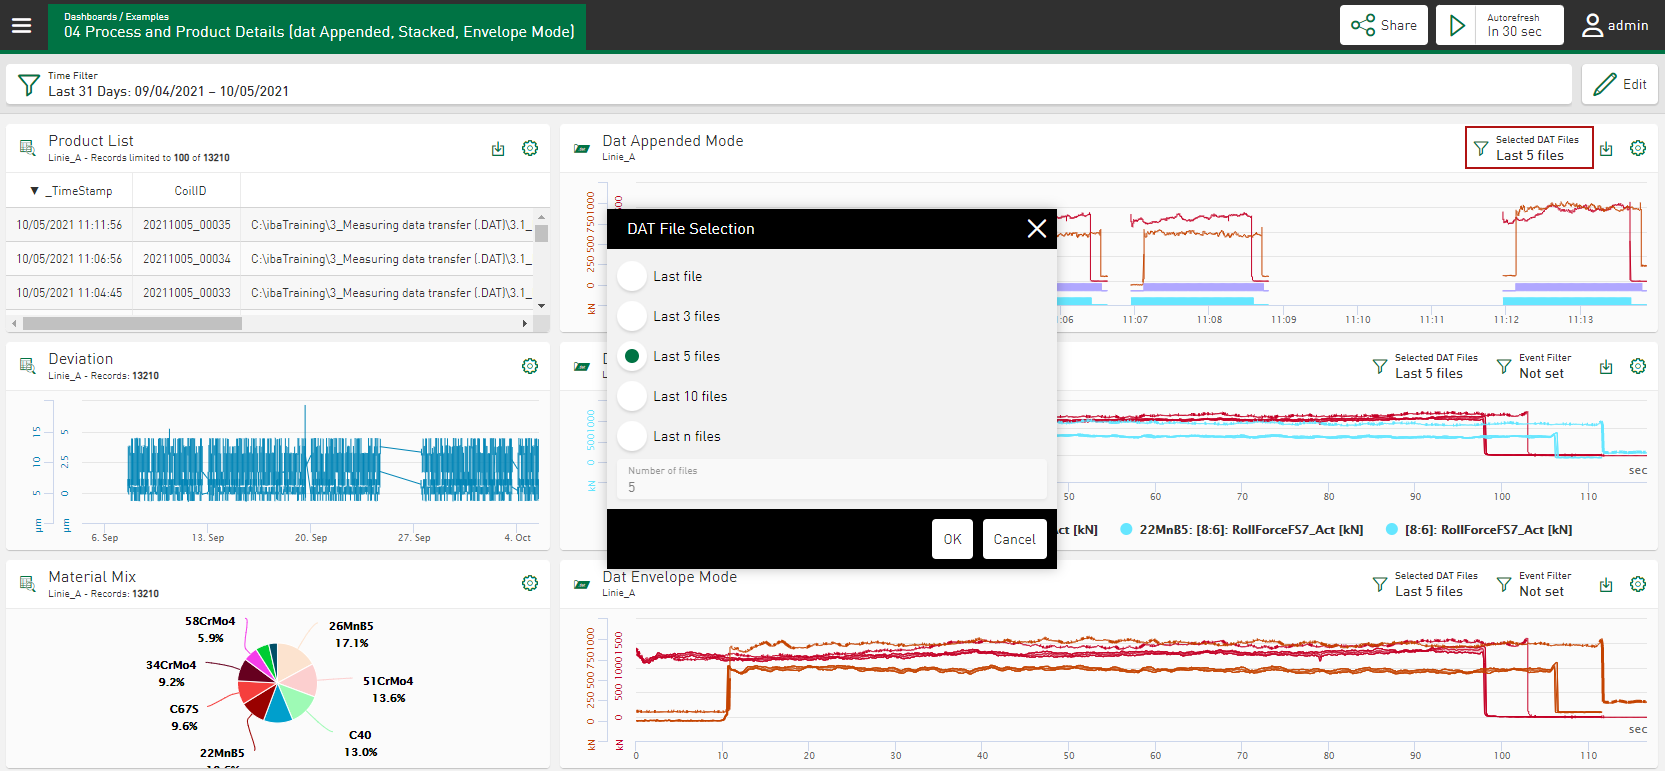
In tiles that visualize signal data from DAT files, you can filter the number of DAT files displayed. The visualization of DAT files is possible in the tile types Line chart, Histogram, Gauge, Bullet graph and Heatmap if you select a datasource configured as an iba file table or activate a segment table, see DAT file signals in segment tables.
-
To open the DAT file selection dialog, tap on the filter symbol in the Selected DAT Files input field.
-
Select from the suggested options.
If you select the Last n files option, also enter the Number of Files. You can display a maximum of the last 50 DAT files.
-
Confirm the changes with <OK>.
If signals are displayed in stacked view or envelope view, the labels of the X-axis show the relative time in seconds or the distance, depending on the length unit, in centimeters or meters.
Dashboard view:
Note |
|
|---|---|
|
If an analysis configuration is linked to the data source used, you can also select the Download analysis as PDC menu item in the dashboard view, see Settings – Analysis Configuration. |
|

