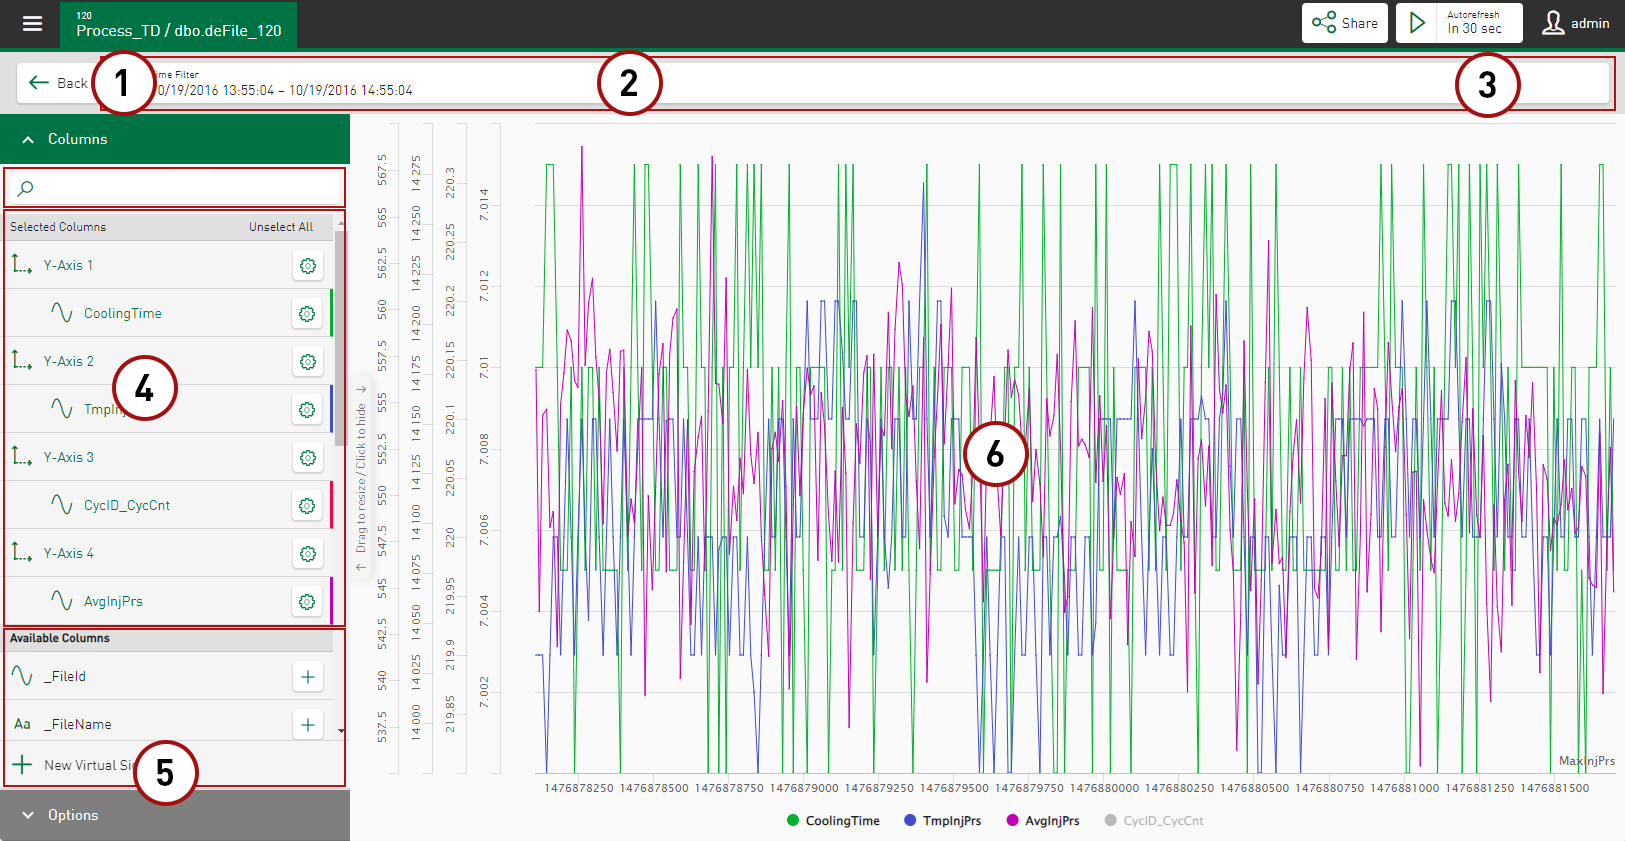
ibaDaVIS offers different tile types for visualizing data and value series. The displayed options and selection fields are based on the selected datasource and tile type.
|
1 |
<Back> |
Back to the dashboard pane |
|
2 |
Time filter and tile-specific filter options |
|
|
3 |
<Save>/<Cancel> |
Save or discard changes to the settings |
|
4 |
Available and selected columns or signals |
|
|
5 |
Options |
depending on tile type and datasource type |
|
6 |
Preview |
Visualization of the selected columns and options |
Depending on the tile type and datasource type, further tile-related buttons are available:
-
File idents
-
Category
-
X-axis Column
-
Color axis
-
Markers
-
Tooltips
Customize view
You can change the width of the area by dragging the control bar <Drag to resize/Click to hide>. For example, signal names can be fully displayed, which were previously not visible.
Tap on the control bar to hide the tile properties and display the preview across the entire width of the screen. To show the tile properties again, tap the control bar again.
