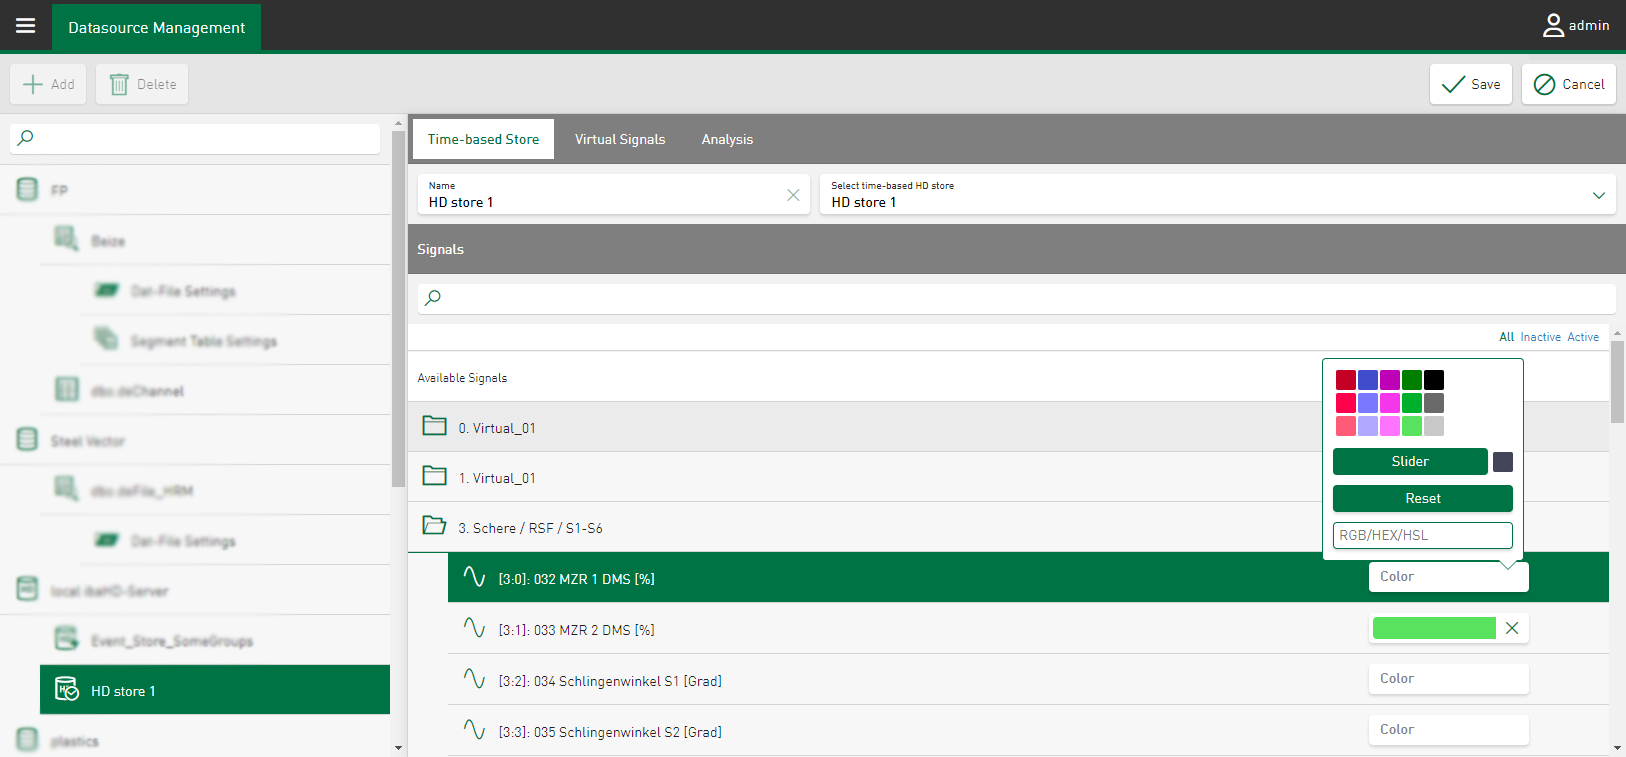
Under Datasource Management, you can define a color for a signal, a value or a virtual signal for display in the tiles. The color is then used for this signal on all tiles and dashboards. The color definition at this point increases the recognition effect of individual signals and saves the individual color configuration in the individual tiles on every dashboard.
The color selection is made at the table settings level or the time-based or event-based HD storage of a datasource and is transferred to the corresponding tile types.
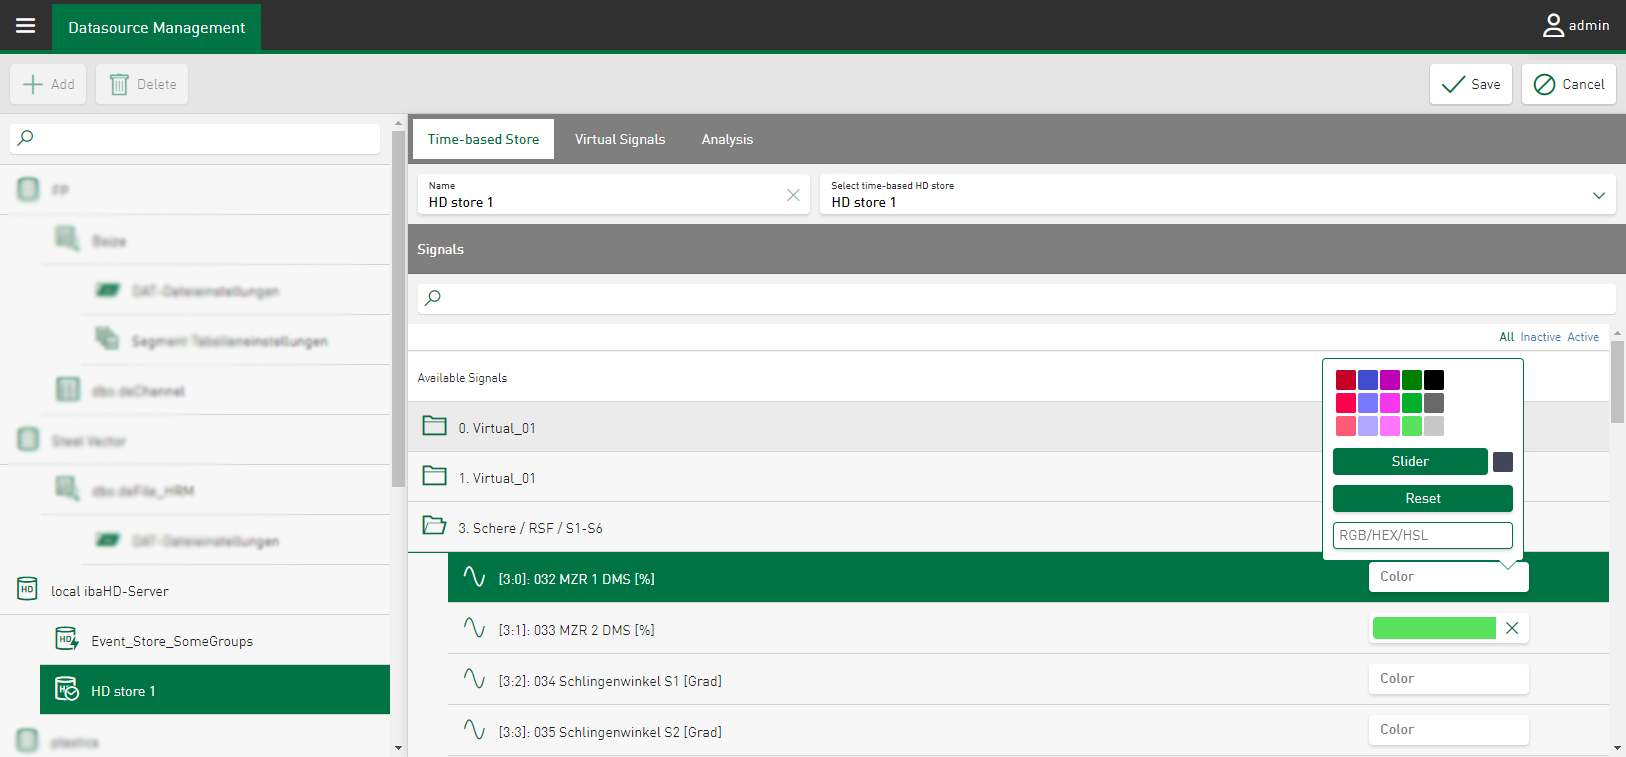
If you tap on the corresponding color field, the color selection dialog opens, which displays the colors from the currently defined color scheme. If none of the predefined colors match the specific value, you can also define the color selection using a slider or by entering an RGB, HEX or HSL color code.
Tapping on the cross in the color field deletes the individual color definition and the original color scheme of ibaDaVIS is enabled.
Ranking of the color definition
For different tile types (e.g. line chart), you can define the color for signals or values in the datasource management or in the tile, see also Color selection in tiles.
The color definitions differ here in that the assignment in the datasource management always applies for all tiles of this datasource. However, the assignment in the tile only applies individually for the respective tile and also only as long as the color definition in the datasource management is not changed.
Color definitions that are subsequently made in the datasource configuration also affect existing tiles and change them accordingly.
If you do not define a color in datasource management or in the tile, the default color selection of ibaDaVIS applies.
Automatic color definition
The colors for newly added signals or values are automatically assigned in the diagrams and can then be changed individually afterwards. The colors automatically assigned to the signals are based on the color sequence of the respective color scheme.
Characteristic of the line chart
Signals with the same unit are not only shown together on one axis in a line chart, but also in the same main color in different shades. You also have the option of changing the color of a signal depending on conditions, see Configuring conditional colors.


