You can add virtual signals in the dashboard tiles.
-
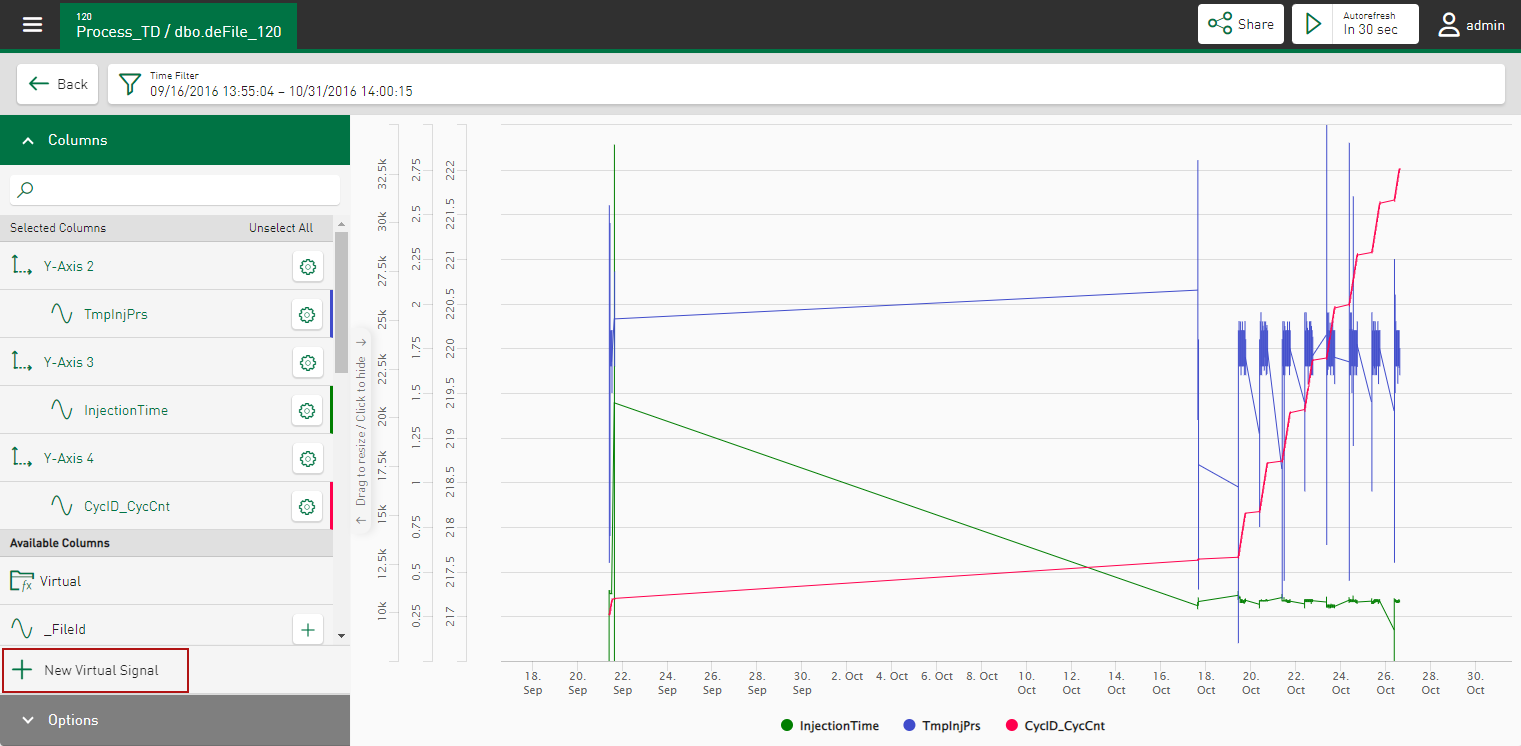
In the configuration view, open the column or signal selection of the tile and tap <New Virtual Signal>.
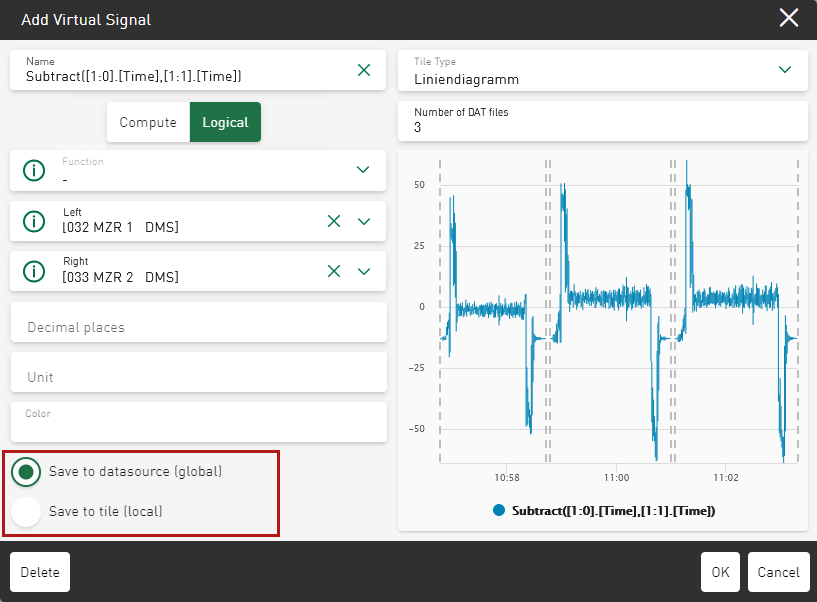
A dialog window opens, which is divided into a configuration area and a preview area.
-
In the configuration area, define a name, the function, signal parameters and input values for each virtual signal.
For more information on the possible functions, see Virtual signals overview.
In the preview area, the currently determined result for the virtual signal is displayed in accordance with the current datasource and the selected functions. The virtual signal is displayed in a line chart as a default view.
-
To change the Tile Type for the display, select it from the drop-down list.
Only the tile types that are compatible with the function are available for selection.
-
Select the area of use
-
The virtual signal can be saved in the datasource and is therefore also available in other dashboard tiles with the same datasource.
-
The virtual signal can only be used within this tile.
-
-
Optionally assign a Unit to the virtual signal.
The default setting of the unit is useful to apply the automatic axis settings in dashboard tiles and to quickly create useful visualizations.
-
Optionally assign a standard color to the virtual signal.
This default color is used in all charts in which this signal is shown.
-
Confirm your entries with <OK>.
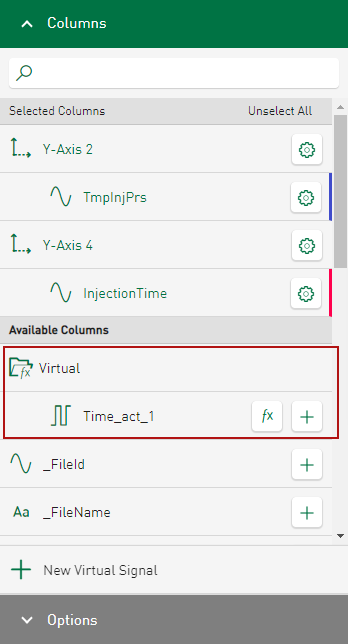
The virtual signal is initially listed in the signal tree under Available Signals in a separate Virtual folder.
-
When tapping on the
 button next to the signal name, the virtual signal appears in the display.
The signals listed in the Virtual folder can be used in the same way as the signals from the ibaHD-Server, DAT files or values from database tables.
You can edit or delete virtual signals using the <fx> button. You can use virtual signals in the same way as signals from the datasource for automatic scaling of the Y-axis.


