The following new functions and improvements are available in ibaDaVIS from version 3.4.
Document display tile
With the new document display tile type, ibaDaVIS v3.4.0 allows you to visualize images or PDF files directly on your dashboard. When adding a new tile, you can select the data source "Documents (relative to ibaDaVIS server)" to access local drives. In the tile options, you can then choose between different view options and display file content side by side or in a gallery, for example.

For information on configuring the document display see Tile type Document display.
Table relation
By accessing local drives as a data source, you can not only visualize data using document display tiles, but also display file lists in table form. The table lists the available images or PDF files with attributes, such as file name, full name, file extension and creation date. A selection of individual files in the table triggers the visualization of the images or PDF files in the document display.

Extension of dark mode
As previously announced in ibaDaVIS v3.2.0, dark mode has been extended to additional areas of the application. In addition to the dashboards, the login and about page, settings area, and dashboard overview are now also displayed in "Dark" mode when set in your user profile.

The settings under Color Scheme also display the autogenerated color shades for light and dark mode.

For further information see User Profile and Settings – Color Scheme.
New dashboard functions
Starting with ibaDaVIS v3.4.0, the dashboard offers new options so you can design your dashboards according to your needs.
Free tile positioning
If configured, you can now freely arrange or place tiles on the dashboard. An additional option is available for this in the dashboard settings.

The tiles no longer follow a predetermined grid pattern.

In the mobile view, the tiles are placed on top of each other in a responsive manner as usual.
Background image for dashboards
You can now also use the dashboard settings to define a background image that fills the dashboard. Select the desired image in the field Background image (relative to ibaDaVIS server).

Tiles are displayed in the foreground.

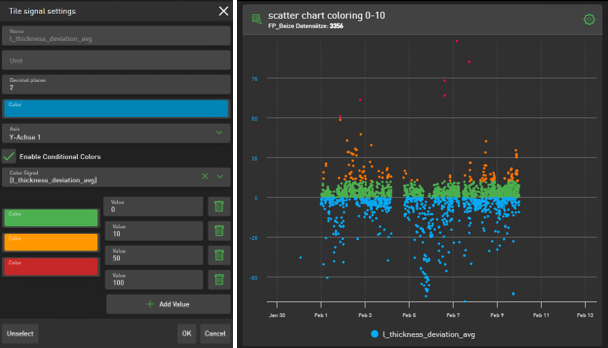
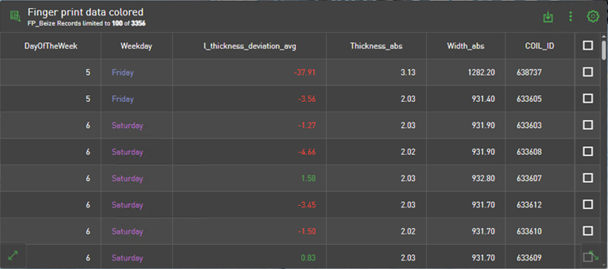
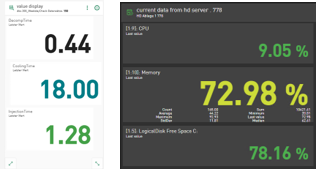
Conditional colors for table, scatter chart, and value display
Conditional colors for signals in line charts were already introduced in ibaDaVIS v3.2.0. Starting with this version, you now also have the option of displaying information in different colors in scatter charts, tables, and value displays, depending on user-defined conditions.
For further information on configuration, see Configuring conditional colors.
Example: Scatter chart
Example: Table
Example: Value display
Further improvements
New virtual function DigitalPulse()
With the DigitalPulse() function you can generate a trigger at fixed intervals or within a user-defined time range starting from a specified point in time.
For further information on the function and its application, see DigitalPulse.
Visualization of difference in bar chart
In the bar chart, you now have the option of displaying differences between the value series or bars shown. To do this, use the new Display difference option in the tile options.

For more information on the settings for the bar chart, see Tile type Bar chart.
ibaDaVIS Status App – new context menu
The context menu of the ibaDaVIS Status app has been revised and adapted to the iba standard. In addition to the familiar options, which are now organized more clearly, you can also open the About ibaDaVIS page directly in your browser. The context menu is now displayed in the Windows language you have set.
