The following new functions and improvements are available in ibaDaVIS from version 3.3.
ibaDaVIS as progressive web app
With v3.3.0, you can install ibaDaVIS as a progressive web app. Progressive web apps (PWA) are hybrid websites that have the characteristics of classic smartphone apps but are accessed via browser.
PWAs offer the following advantages over conventional browser access to the website:
-
Use of content on any end device
-
Use of web content even with a poor or non-existent Internet connection
-
Fast loading of websites
-
Continuous updates of the app
-
Secure connection through the use of HTTPS endpoints
You can find out how to set up ibaDaVIS as an app on your computer here: Installing ibaDaVIS as progressive web app
Note |
|
|---|---|
|
If ibaDaVIS is installed as an app with version 3.3.0 on your system, application-related data is stored on the system. If you uninstall ibaDaVIS v3.3 or higher and use an earlier ibaDaVIS version without uninstalling the app, side effects may occur that are caused by program parts stored in the app. To replace ibaDaVIS v3.3.0 or higher with an earlier version, remove the app from the end device beforehand. If you switch from versions higher than v3.3.0 back to v3.3.0, the app will automatically download changes and run without restrictions with the lower version. |
|
Other documentation |
|
|---|---|
|
Further information on the topic of progressive web app (PWA) can be found at: https://learn.microsoft.com/de-de/microsoft-edge/progressive-web-apps/ |
|
URL extension with filter parameters
In ibaDaVIS, it is now possible to add specific filters to the URL of the dashboard or tile. This allows you to define filter parameters for time or value specifications in the URL. When the dashboard is called up, the filter values specified in the URL are then applied to the dashboard or the displayed tile and the tiles are updated.
Examples and a list of supported filter functions and parameters can be found in chapter Defining filters via URL.
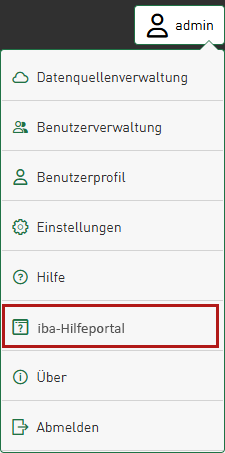
Access to the iba Help center from ibaDaVIS
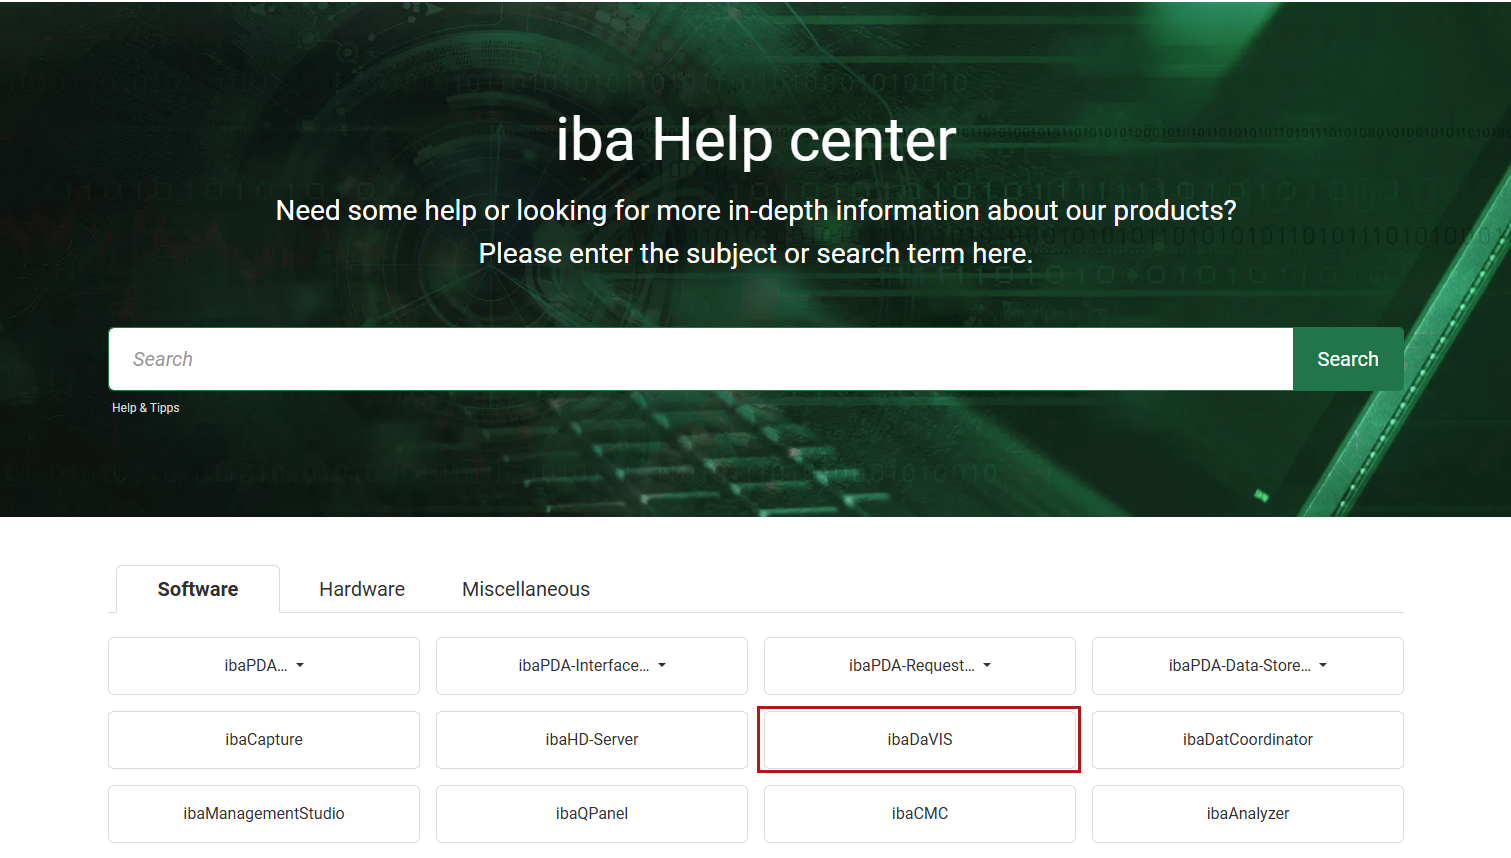
As of ibaDaVIS v3.3.0, you can access the iba Help center https://docs.iba-ag.com Directly from the administration menu.
|
|
|
You can find all documentation on iba products in the help center.
New virtual functions
With ibaDaVIS v3.3.0 new virtual functions are supported. Detailed information on the use of virtual functions can be found here: Configuration of virtual signals
XSize()
Returns the length of the valid value range for the selected signal in the X direction, in seconds for time-based data and in centimetres for length-based data.
XRange()
Returns the current time range that is set as the dashboard filter in seconds.
NOT()
Returns the logical NOT for the selected signal.
Int()
This virtual function has been available since ibaDaVIS v3.2.1 and v3.2.2 and returns the integral of a signal.
General improvements
Pie chart: Change from category-based view to multiple column selection
The pie chart supports two modes. Previously, it was possible to create a pie chart by selecting a signal, a database table column or a time period in the Signals or Columns section, and additionally selecting another signal or a database table column as a category. The pie chart then shows the aggregated signal values grouped by category. Clicking on one or more segments creates a filter for the categories on which the selected segments are based.
In the second mode that has now been added, you can select several signals or database table columns as signals to be displayed. A signal for categorization is not selected. The pie chart now shows one segment per selected signal and displays the maximum, minimum or average value depending on the selected aggregation operator. Clicking on one or more segments does not result in filtering.
System requirements and administration
Limitation of the number of log files
The maximum number of log files in the directory C:\ProgramData\iba\ibaDaVIS\Log is limited to 40 files. The oldest log files are replaced by newer ones.
Changed file names and folder structure for localization files
The customizable localization files for the signals can be found under:
C:\ProgramData\Iba\ibaDaVIS\assets\locales\
Instead of the previous language-based organization in folders, the localization files with language tag are listed directly in the folder as JSON files.
Renamed options for appended view
In the line chart, the options Synchronized on recorded time and Appended view have been renamed to Appended view – recorded time and Appended view – relative time for better comprehensibility.
See Tile type Line chart.

