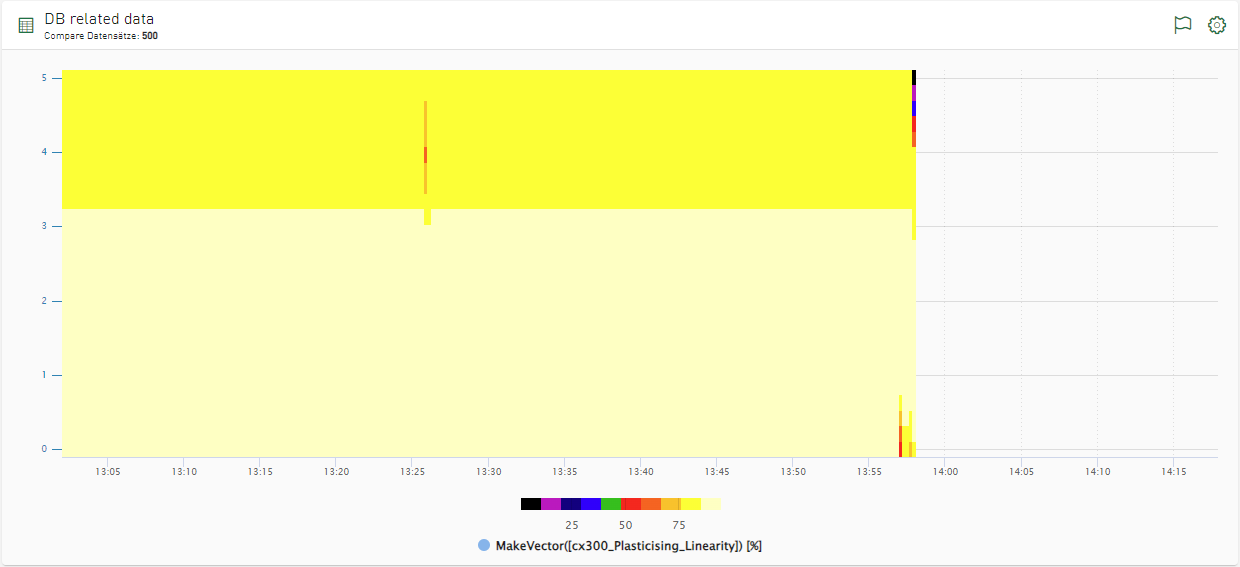
How can I visualize spontaneous anomalies or changes for many signals over a long period of time?
The MakeVector() function allows you to combine signals from DAT files or columns of a database table into logical signal groups and display them in a heatmap. Proceed as follows:
-
Create a new tile of the type Heatmap.
-
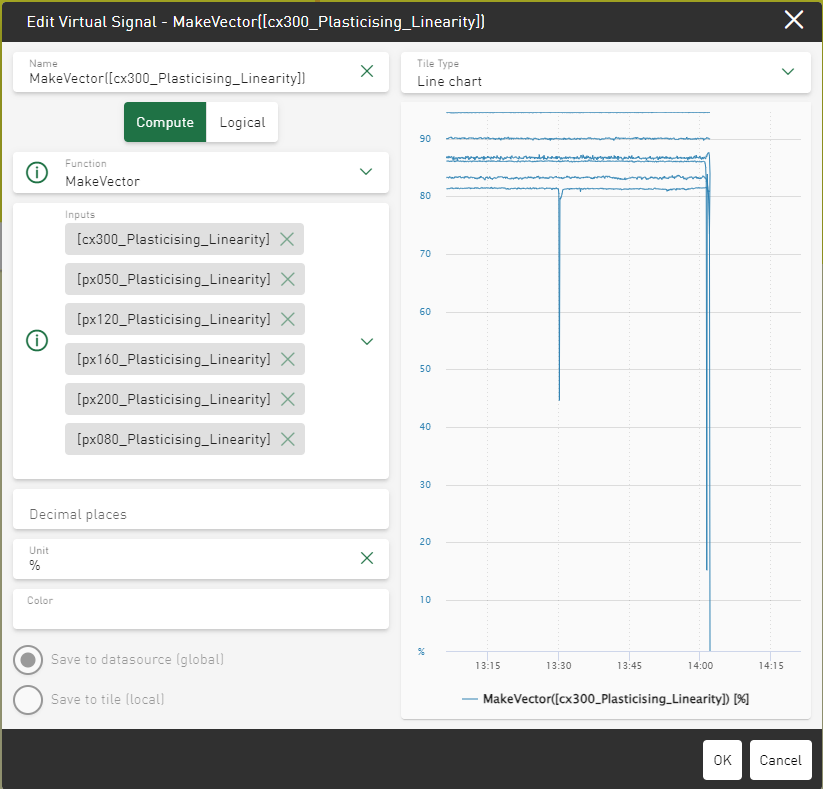
Create a virtual signal and select the MakeVector() function under Calculate. In the Inputs field, select at least two signals that you want to combine.
The order in the list is used as a sequence in the generated vector, starting with "0".
-
Select the virtual signal under Available Signals.