Example of visualizing the process status in a pie chart
A pie chart is used to show the ratio of the time a valve was closed or open. The base signal is a digital signal in the ibaHD-Server.
-
Create a virtual signal in the pie chart tile using the "If" function.
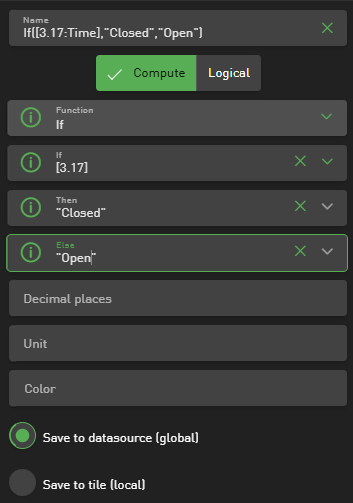
Based on the status, the strings "Closed" or "Open" should be returned.
-
Under Available Signals, select a signal that has values for this range.
-
Under Group by Signal, select the virtual signal you created earlier.
-
In the options, select the "Count" function in the Aggregation field.
-
If necessary, change the category colors.

The pie chart shows the ratio of "Closed" (red) to "Open" (green).

For further information on the pie chart, see Tile type Pie chart.