DAT file signals in segment tables can be read directly from the database instead of from the referenced DAT file. This function requires the extraction of selected signal data with the DB functionality of ibaAnalyzer into the segment table. In addition to the characteristic values from the index table, the DB functionality of ibaAnalyzer also inserts signal values in a structure defined by the user into the tables.
Other documentation |
|
|---|---|
|
For further information about the correct extraction using the DB functionality of ibaAnalyzer, please refer to the ibaAnalyzer documentation. |
|
-
Select a table in the Datasource Management under <Add iba File Table> to retrieve signal data in the segment table.
-
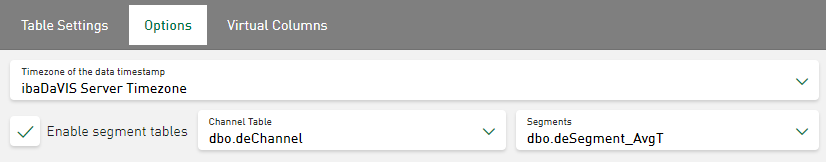
Open the Options tab and select the <Enable segment tables> option.
-
Select the Channel Table and the Segments in the specified fields.
The specified table names are filtered according to the supported table format.
Note

If you work with the DB functionality of ibaAnalyzer-, it is possible to store the data in multi-column format (MC format). This format works on the basis of several tables, which all have the segment table name and differ in suffix. Select the table with the suffix "_AvgT" as the segment table if you are working with the MC format.
Now, signals from the database tables are visualized instead of those from DAT files.
When enabled, a new menu item Segment Table Settings additionally appears below the
selected table![]() . When disabled, the menu item is removed again.
. When disabled, the menu item is removed again.
Here, a default color for signals from segment tables can be defined for each configured iba File Table. In each tile (e.g. line chart) that displays signals from segment tables of this datasource, these color settings are used to visualize the signal trends. The signal color can be changed at any time in the respective tile.
Note |
|
|---|---|
|
Changes in the color scheme are also applied to default colors for DAT file signals from segment tables, see Settings – Color Scheme. |
|