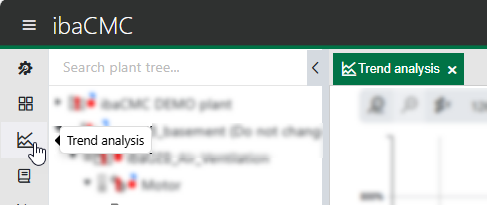
In the trend analysis, the user can analyze different trends. Trends can be dragged from the plant tree (virtual trends and status trends) to the trend view using drag & drop, as well as plant tree items if trends are located directly below them, as is the case for sensors and components. The trend data for the time interval that has been set is displayed. The trend analysis provides both an absolute and a relative representation of trend data. For an explanation of the differences between the absolute and relative views, see Absolute and relative view. The relative view shows how significantly the trend data differs from the alarm limit. For further information about limit settings, see section Limits.
To open a trend analysis, click on the corresponding icon in the menu:
