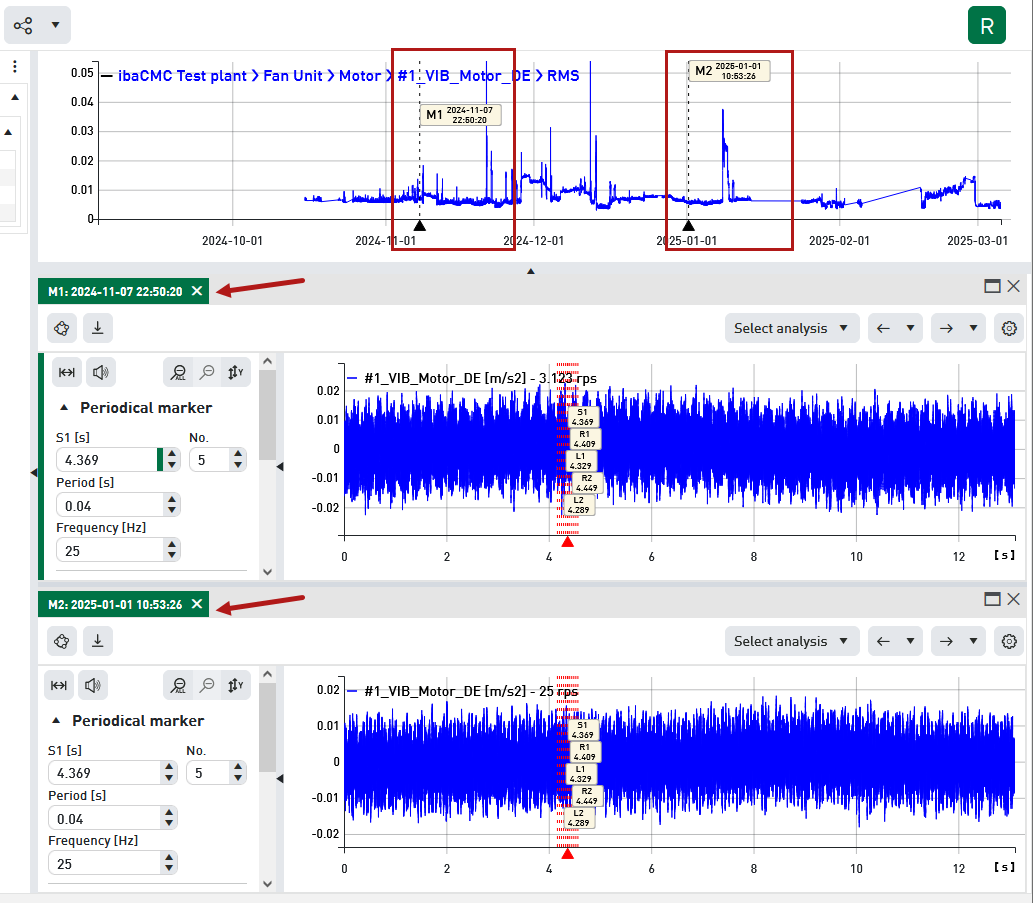
The signal analysis window offers to open more than one so called tiles. Each tile contains the analysis of the signal at a specific point in time.
Hence, you can examine variations of the time signal or spectrum over a longer period of time.
To open another tile follow these steps:
-
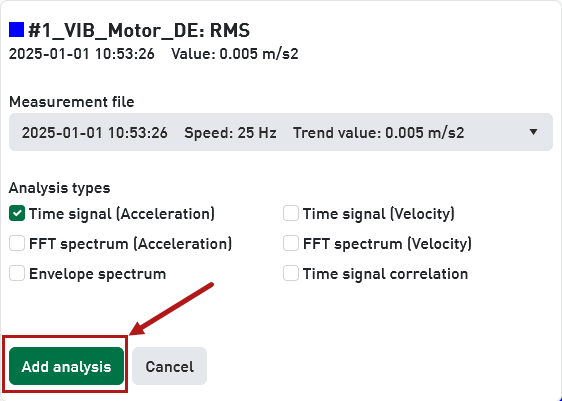
Make a right-click in the upper trend graph at the X-position you’d like to analyse. The well-known dialog box like for opening an analysis opens, but this time it is for adding an analysis.
-
Click on <Add analysis>. A new tile appears in the signal analysis window which shows the same analysis at a different point in time. Furthermore, there is another black marker in the upper trend graph.


You may add more tiles this way:
-
In tile view up to 6 tiles
-
In row or column view up to 4 tiles
Use the layout menu to control the automatic arrangement of the tiles.

Example for column view

Example for row view

You can also change the tile arrangement with the mouse at any time by drag & drop on the tab. A shaded area indicates where the tile will dock.