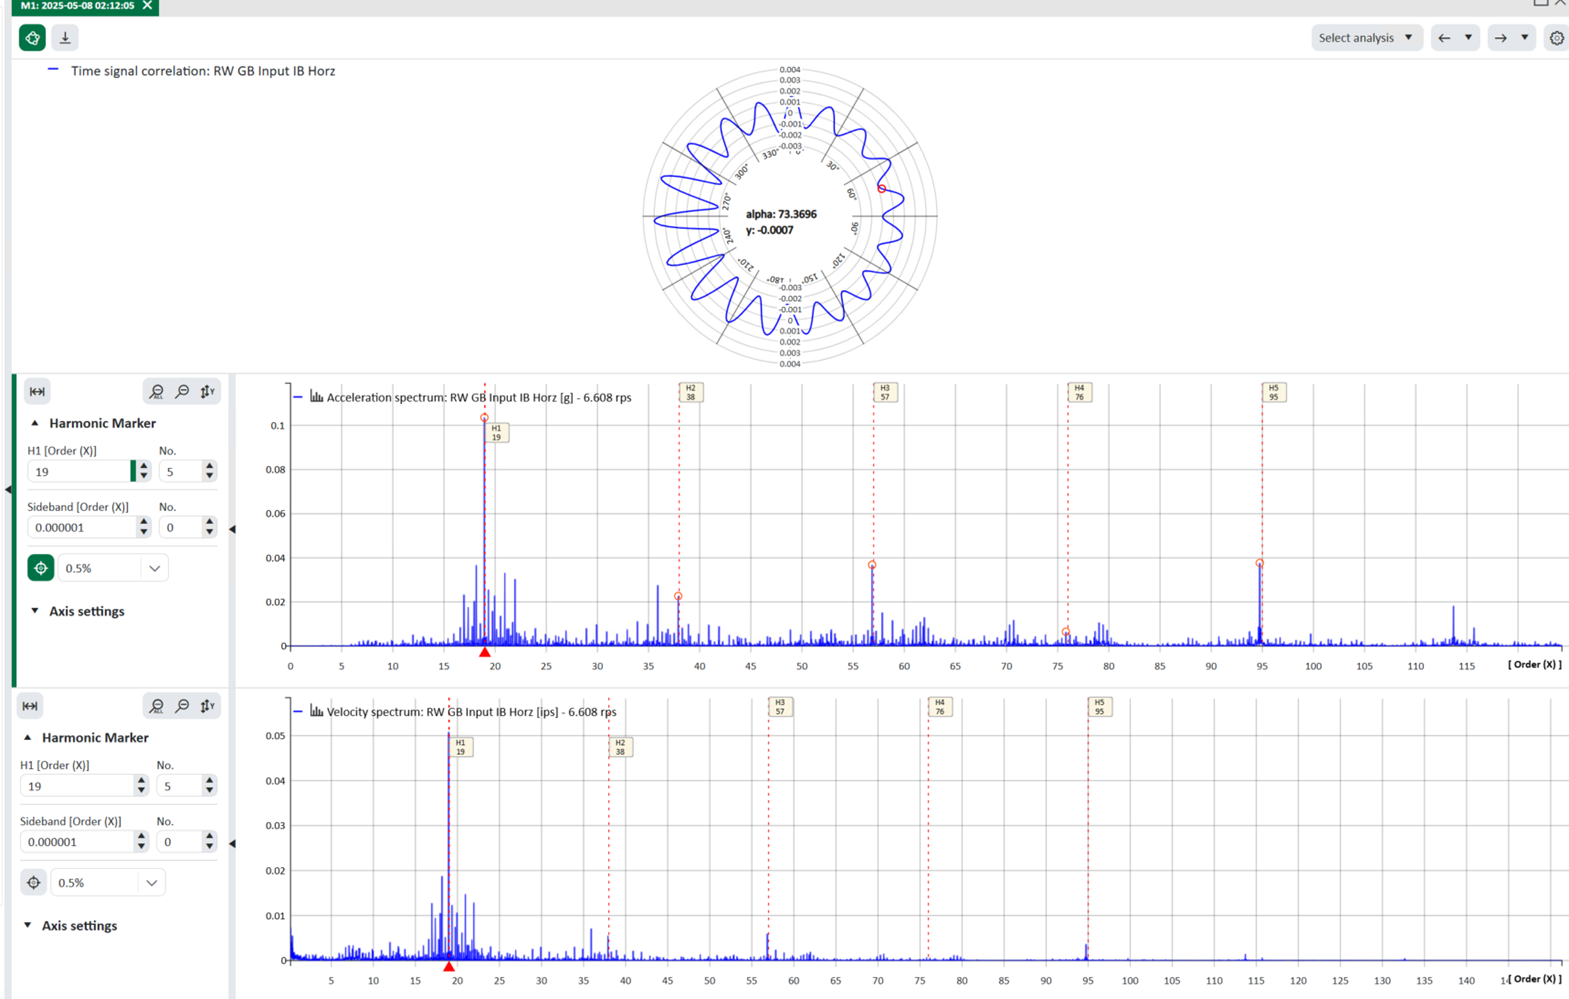
Time signal correlation involves correlating the vibration velocity signal with the shaft speed and representing it as a circle in a chart. This enables periodically occurring damage to be detected and localized. Using the example of a gearbox, each tooth can be identified at the circumference of the circle. Depending on how much energy is behind it, the amplitude either increases or decreases. If there is damage to a tooth and it produces higher vibrations, the amplitude of the tooth increases and we can assume that the relevant tooth is damaged. The following figure shows an example of time signal correlation. The average value of the rotational speed which is stored in the DAT file in the Info channel under RPS will be taken for speed (rps).
