The following new functions and improvements are available in ibaCMC from version 3.6.
Enhanced trend monitoring and alarming
The method of limit value monitoring has changed in version 3.6.
In previous versions a status change or alarm was triggered when a defined number of consecutive samples, based on the hysteresis settings, exceeded a threshold.
The new method instead, uses the moving average or moving median, which is calculated over a given aggregation interval. Only if this value exceeds the threshold, a status change or alarm is triggered.
The new method helps to reduce false alarms caused by random outliers or natural process variations.
Note |
|
|---|---|
|
The hysteresis settings have been removed completely. Only the settings of aggregation method (average or median) and aggregation interval will be used for monitoring. You can make these settings in the plant configuration on the Monitoring tab. |
|
For more information, see also the next section.
Trend data aggregation for analysis and monitoring
With version 3.6, the trend visualization changed too.
Comparison with previous versions:
|
Previous (v3.5.1 or older) |
Current (from v3.6.0) |
|---|---|
|
Trend view
|
Trend view
|
|
Monitoring
|
Monitoring
|
Monitoring settings
You can find the monitoring settings in the asset configuration on plant level:

The aggregation method defines the algorithm of the calculation, which is used for status determination. There is a choice between moving average and moving median.
The aggregation interval defines the time frame, which contains the data for calculation.
Trend analysis
The legend of the trend analysis shows two controls for indicating aggregation method and interval as well as displaying the alarm limit (if configured).

If needed, you can change aggregation method and interval right here for each area in the trend analysis and filtered trends. A change only applies to the view and does not affect the monitoring settings.

An orange dot in the control indicates that the aggregation settings for the trend do not match the default settings.

If you want to change the settings for all trends at once, use the drop-down menu on the <R> button.

Integration of ibaPDA process signals
The integration of process signals facilitates the use of any ibaPDA signal, which is acquired by CM devices such as ibaDAQ or ibaM-DAQ via the available ibaPDA interfaces in ibaCMC.
These signals can be used in ibaCMC for purposes as follows:
-
Recording in snapshots
-
Acting as trigger signals for snapshots
-
Serving as a speed signal for component monitoring and order resampling
-
Acting as a filter signal for trend filters
-
Trending and monitoring of statistical indicators, such as average, minimum, maximum and standard deviation
Special modules have to be configured in ibaCMC to use the process signals, automatically creating a corresponding virtual module in ibaPDA for each.
Only analog and digital signals are permitted. Digital signals are automatically converted in analog values 0/1. Text signals are not permitted.
Note |
|
|---|---|
|
ibaPDA v8.12.0 or higher is required for using process signals. |
|
A detailed description of the process signal configuration can be found under Using ibaPDA process signals.
Sending statistical values via TCP send telegram
The Update mode setting has been added to the configuration of TCP send telegrams. You can choose between After snapshot and Cyclic.

After snapshot means, that the values in a send telegram are updated after a snapshot was taken.
Cyclic instead means, that statistical values like RMS, Peak-to-Peak, Crest factor and vRMS 3-1000 are updated cyclically, based on the transmission cycle time of the telegram.
Constraints:
-
Cyclic cannot be applied to component based trends. These can only be updated after a snapshot.
-
ibaCMU-S supports Cyclic only.
-
ibaDAQ and ibaM-DAQ support both modes.
Note |
|
|---|---|
|
ibaPDA v8.13.0 or higher will be required for using this function. |
|
Support of ibaMS8xICP
ibaDAQ now supports the input module ibaMS8xICP. This module is the predecessor of the ibaMS8xIEPE module and can be found in older plants. This makes it possible to replace ibaCMU-S by ibaDAQ while retaining the input modules.
Sensor or cabling problems are determined in ibaCMC based on the used range of the signal, with the calculation performed on the ibaPDA side. Thresholds and limits can be configured for each sensor in ibaCMC. Signal condition checks are only evaluated during snapshot measurements.
Configuration of bandpass filter for envelope spectrum
The bandpass filter configuration for sensors has been enhanced by two additional options:
-
Cutoff frequency settingsThe cutoff frequency can be configured individually. By default, it matches the lower filter frequency. If the lower filter frequency changes, the cutoff frequency changes accordingly, unless you modify the cutoff frequency setting.
-
Downsampling optionThis option was created to enable the monitoring of low running machines as well as fast signals in the same CM device. By means of the downsampling you can select a different sampling rate for the envelope spectrum, in order to define lower filter frequencies.

The filter settings are only available if the sensor is connected to the CM device.
Visualization and operation
Hiding marker labels
You can enable or disable the display of marker labels easily by mouse click on H1 (spectrum) or S1 (time signal). At first, all markers are displayed by default. If sideband markers are enabled in the spectrum, the control is as follows:
1st click: hide sideband marker labels only
2nd click: hide harmonic marker labels too
3rd click: show all labels again
Filter and search function in multi-select menus
All drop-down menus with multi-selection support the search feature. If you enter a search string, then only items containing this string are available for selection.
Example: Selection list, showing only plants with “iba” in their name.

Tooltips in kinematic grid
The tooltips in the kinematic grid now show the name of the defect frequency instead of the component name.
Status display in plant tree
The normal status of plant components in the plant tree is now represented by a green icon instead of a grey icon.
|
Old 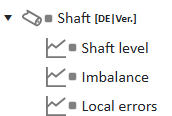 |
New 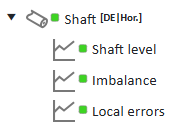 |