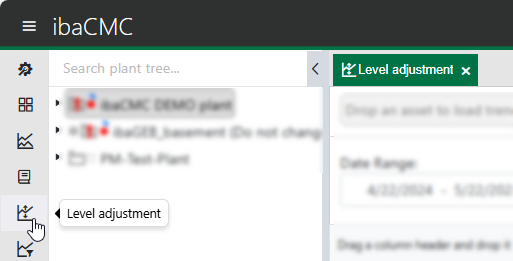
The “Level adjustment” tool is used to calculate limits based on the trend values. The suggested values can be adjusted by the user before saving. Limit adjustment is primarily useful if a large number of limits have to be adjusted, for example after system startup.
To obtain good suggested limits, it is crucial to set the correct period for the selected data.
To open limit adjustment, click on the corresponding icon in the menu bar:
Level adjustment tool
The limits are displayed, based on the filter parameters.
Period selection (date range)
-
Start (From -): The start date for the time range to be used for calculation of the new limit settings. The default value is one month in the past.
-
End (- To): The end date for the time range to be used for calculation of the new limit settings. The default value is the current date.
-
Status classification: To calculate the Warning, Alarm and Critical classifications, the number of upper or lower limit violations in the From-To period is used.
The number of limit violations is shown in the Qty. column.
|
Classification |
Description |
|---|---|
|
Warning |
The warning limit is used for calculation of the number of upper or lower limit violations. |
|
Alarm |
The alarm limit is used for calculation of the number of upper or lower limit violations. |
|
Critical |
The critical limit is used for calculation of the number of upper or lower limit violations. |
Warning
The Warning classification is selected.
With a limit setting of 220.00, the trend displayed in the list, e.g. FFT inner race, reached the Warning status 20 times in the observation period (given by From and To). A value of 20 would then be displayed in the Current limits -> Qty. column.
Threshold type
The limit type Upper limit (value exceeds limit) and Lower limit (value falls below limit) is selected here.
The buttons next to the Limit type dropdown list are described below:
|
Buttons |
Description |
|---|---|
|
Enables the filter for the selected limit type |
|
|
Enables automatic creation of limits if none exist. Click on <Calculate> and then <Submit visible items> to create the limits. |
Note
The buttons are only displayed for migrated trends.
Factor
The factor is multiplied by each suggested limit as soon as you click on the <Calculate> button.
In addition to the factor, the virtual trend type is used to calculate the suggested limit.
Max. number of trends
The maximum number of virtual trends that are simultaneously loaded in the list.
Virtual trend type
The virtual trend type shows the set factors for the virtual trend types. Some virtual trend types are handled more sensitively than others.
Example - Crest factor
For crest factors, new limits are suggested such that the virtual trend would be at 50% of the new limit in the observation period, compared to only 15% for virtual trends calculated from the envelope curve spectrum for roller bearing cages.
Operation
The plant tree component for adjustment can be dragged to the limit adjustment tool using drag & drop.
Tip |
|
|---|---|
|
If an entry from a high level, e.g. a plant or an aggregate group, is selected, the number of associated trends can be very high, which significantly increases the loading time. Therefore, we recommend selecting smaller plant items, e.g. component groups. |
|
If data has been loaded successfully, the values for the suggested new limits can be edited directly in the relevant fields.
Note |
|
|---|---|
|
For migrated trends, in addition to the limits settings for the hysteresis and the notifications can also be made. |
|
Calculation
If changes have been made to the filter parameters, the <Calculate> button can be used to update the list. The new suggested limits are not yet transferred to the database.
Save
The new limits are only adopted when you click on <Apply limits>. Only the values actually visible in the list are adopted. All other limits remain unchanged.
