Diagnostics is used to obtain a rapid overview of the state of the measurement hardware and the analysis server.
System diagnostics tab
You get the Systems diagnostic tab by clicking on the corresponding button in the toolar.
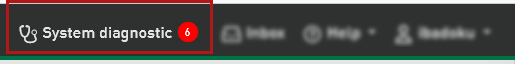
The button indicates the number of warnings (yellow) or errors (red). If errors and warnings are existing, the errors will be indicated. A tooltip on hover breaks down the messages.
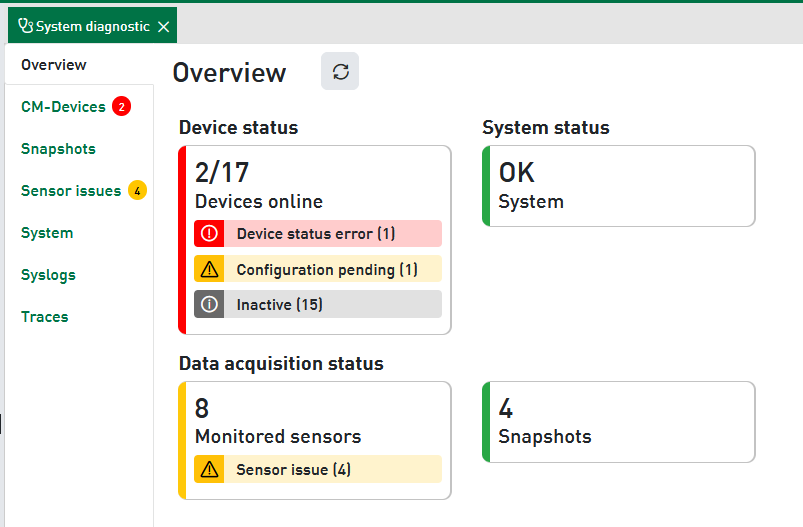
The tab opens with an overview, showing the major status information. Furthermore, there are subordinated tabs providing more detailed information about the different areas.
Overview
The overview consists of different tiles showing status information about the devices, the system and the data acquisition. If a tile shows status messages, you'll get more detailed information by clicking on the message.
CM-Devices
In this tab you'll find the CM-Devices, as selected in the user profile and visible in the plant tree, listed in a table with selected information about status, serial number, IP address, software version etc.
If needed you may filter the table by CM-Device types or plants.
If you click in a row, the view will switch to detailed view on the corresponding device.
In the Info tab you see information which is cyclically refreshed by the device. A red row indicates that there is a device error which should be fixed. Examples for such critical device errors are TCP telegram not connected, data acquisition stopped or license invalid.
In the Logs tab you'll find the recent logs sent by the device. These logs can be filtered by level, date and text.
Snapshots
In the Snapshots tab you can see an overview of the statistics of the snapshots.
It shows how many measurements are planned, how many were successful and the success rate.
If the success rate falls below the warning threshold configured for the plant, a yellow badge is shown for these success rates. The success rate is always calculated by dividing the actual measurements by the total possible measurements.
The considered time range can be configured per plant.
Default setting: 1 week, starttime 0:00 h, endtime 23:59 h.
Sensor issues
All vibration sensors that have a sensor defect are listed here.
A sensor defect is detected automatically when using ibaMS8xIEPE modules and is output directly by the module. If the older ibaMS8xICP modules are being used, a sensor defect is output if the effective signal drops below 0.05% of the measurement range.
Example
If a +-50 g sensor is used, it has a measurement range of +-500 m/s².
0.05 % of 500 m/s² is 0.25 m/s². If a sensor is not connected, only signal noise is received at the input, which is in the range of 0.05 m/s². This is well below the limit of 0.25 m/s² and a sensor defect is output.
System
This tab shows system-relevant information, such as MQTT broker status, settings, folders, access rights and the disk space consumption of the archive folders.
Syslog
The Syslog tab shows the progression of system events. An event is made up of a level, the time, and a description. The level reflects the significance of the event. The following types exist:
-
Error
-
Warning
-
Info
-
Debug
The list is sorted in descending order by date, i.e. the most recent entries are at the top. Clicking on an event opens the detail view showing the entire text. Clicking on <x Close> takes you back to the list view.
Traces
Traces are temporarily saved event records. The record starts after opening the Traces tab and is deleted again when exiting. Trace logs are created in real time and thus allow easy observation of recently triggered events.
New trace logs are added to the list at the bottom. Automatic scrolling is enabled by default. This functionality can be disabled if required. To better emphasize the events you are looking for, you can enter a search text. Trace logs containing that text are marked in color.