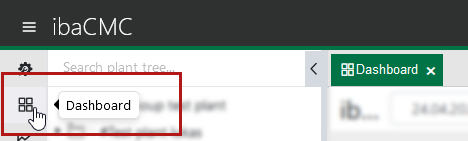
In order to be able to use the dashboard, it has to first be opened using the menu. When the user logs in, the dashboard is opened by default.
Click on the icon or the menu command for the dashboard:
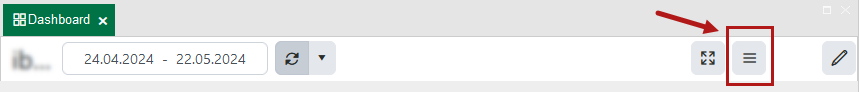
Dashboard toolbar
|
Icon |
Description |
|---|---|
|
Text1 > Text2 > ... |
Name of the dashboard. The name is specified when creating the dashboard. For greater clarity, enter a unique and descriptive name based on the plant tree, e.g. Aggregate group > Aggregate. |
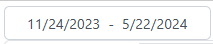 |
Current start and end time for the values to display on the tiles. The time range is set when creating the dashboard and applies to all tiles in the dashboard. The field provides a date selection function. Open the date selection by clicking on the field and select a different date or a different period. |
 |
Refresh interval; here you can select whether or not the display is to be refreshed automatically. The refresh intervals 5 s, 30 s, 1 min, 5 min, and 10 min are available. The time range is set when creating the dashboard but the refresh time is not. |
|
Switch to full screen mode Full screen mode active; click to exit full screen mode |
|
 |
Open dashboard management |
 |
Edit current dashboard |
Create user-specific dashboards
Open dashboard management using the button in the toolbar in the dashboard window.
All dashboards created are listed here.
The 3 dots button to the right of each dashboard gives you the options for copying, editing, or deleting the dashboard.
You can use the <+ Add> button to create a new dashboard.
In the resulting dialog box, enter a name for the dashboard and select a period from which you subsequently want the values to be displayed on the tiles.
You also have to link the new dashboard to a plant tree item. To do this, drag the relevant plant tree item into the corresponding field using drag & drop.
Then click on <Apply> to complete creation of the dashboard.
Switch to dashboard editing mode (button with pen symbol) to add widgets and make further settings.
Adding tiles
If you click on the <+ Tile> button in the toolbar, a dialog box opens containing the settings for the tile to be created. It is important to select the type here. The settings such as name or unit can be adjusted later.
For a description of the tiles, see chapter Tiles.
Specifying the time range
A basic time range is already defined when creating the dashboard. However, you can adjust the period at any time using the date selection function in the time range field, either spontaneously in view mode or in the dashboard settings.
Deleting tiles from the dashboard
You can delete all or individual tiles. In editing mode you can use the <Delete all> button to remove all tiles from the dashboard.
To remove individual tiles, click on the 3 dots to the right of the tile and then select <Delete>.
Changing the settings
You can use the <Settings> button to open the dialog box containing the dashboard settings. Here, you can change the name of the dashboard, the default time range or interval, and the linked plant tree item.
In order to change the default time range, enter the time range by using these short forms:
-
1d = 1 day
-
1w = 1 week
-
1M = 1 month
You can even combine those entries, e.g. "3M 2w 6d" for 3 months + 2 weeks + 6 days.
Note |
|
|---|---|
|
Linked dashboards are indicated by a small dashboard symbol in the plant tree. To open the linked dashboard, simply drag the plant tree item to a free area of the dashboard. Alternatively, you can open a dashboard through the context menu (right click) on the plant tree item. |
|
Importing/exporting dashboard layouts
You can select the <Options> button to use the export and import function. This enables to share dashboards with other users, based on JSON files.
After running an export, you receive a JSON file containing all settings for the current dashboard, the tiles it includes and their arrangement.
To import this kind of JSON file, first create a blank dashboard or select an existing one, switch to editing mode and then run the import. A new dashboard is then added, which is assigned all the properties from the JSON file.