A dynamic table automatically adjusts its size to accommodate the amount of specified data. Therefore, it is recommended to place such tables at the end of the report or to reserve sufficient space for them.
Requirements
-
To create a dynamic table, you have specified the appropriate data in the Table Data window of the ibaAnalyzer report generator interface. For further information, see Table data.
-
An additional level named "Dynamic_Table" with the condition
Page()>=2is available for the dynamic table, see Using layers.
Procedure
-
Select the "Dynamic_Table" layer to display, and deselect all other layers.
-
From the Insert menu, select the Table object.

-
Use the mouse to drag a rectangle in the workspace where you want to place the table.
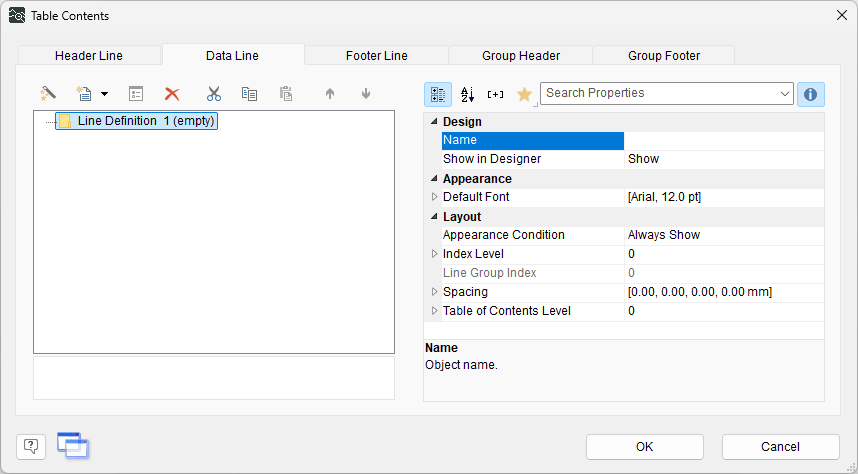
The Table Contents dialog opens.
-
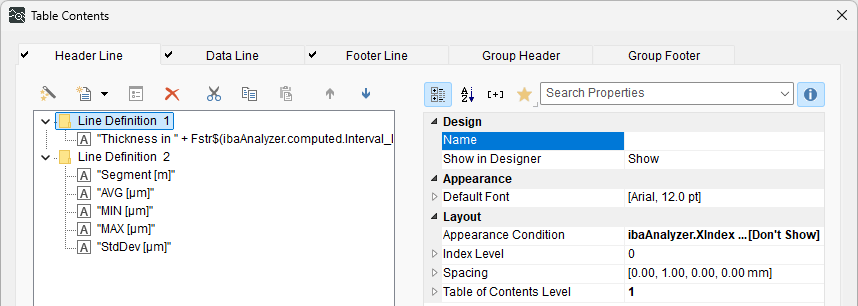
In the Header tab, define two lines for the header.
Add one column to the first row and five columns to the second row using the Add a Column icon.

You can use the Group header in the same way. Additional features are available here, which are described in more detail in the combit documentation.
The regular content editing dialog opens. You can use all existing variables. Enter text in quotation marks.
-
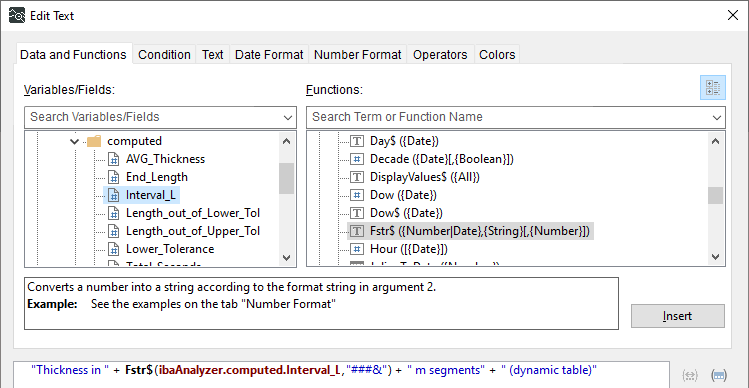
For "Row Definition 1", use the interval size of the data to be displayed, which is available as the variable Interval_L and must be converted to a string.
-
For the second header row, enter the names of the desired columns as separate text columns. Enter the names of the field variables from ibaAnalyzer as text.
-
In the Data Row tab, insert 5 columns. Assign the corresponding field variables from ibaAnalyzer to each column.
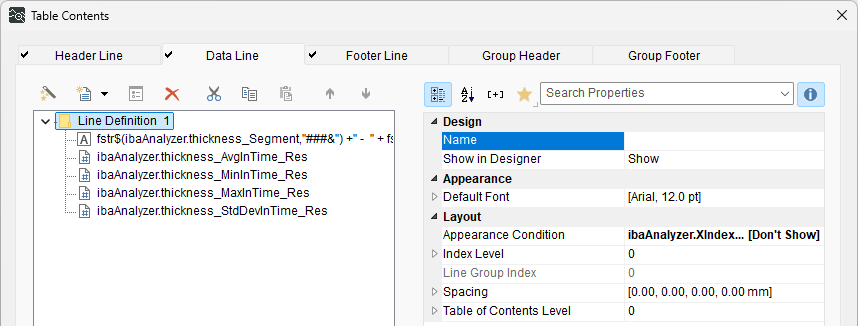
The first column specifies a range. Use the following variable combination:
fstr$(ibaAnalyzer.thickness_Segment,"###&") +" - " + fstr$(if((ibaAnalyzer.thickness_Segment+ibaAnalyzer.computed.Interval_L) > ibaAnalyzer.computed.End_Length, ibaAnalyzer.computed.End_Length, ibaAnalyzer.thickness_Segment+ibaAnalyzer.computed.Interval_L),"###&") -
To create a truly dynamic table, specify a display condition for the data rows and header rows.
Use the field variable XIndex from ibaAnalyzer with the condition "=5":
ibaAnalyzer.XIndex = 5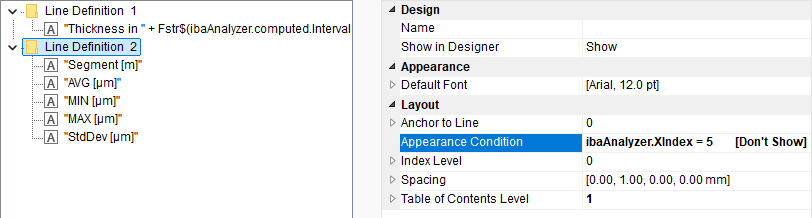
This condition refers to the table data from ibaAnalyzer in row 5 of the X-values.
-
Optionally: Insert a footer that displays the total number of segments.
Change the display condition to
LastPage()so that the footer is displayed only at the end of the table (on the last page).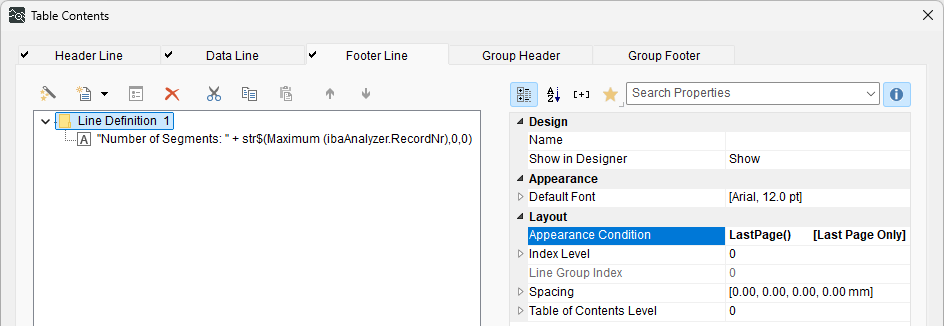
-
If necessary, use the anchor points on the object frame to resize the table and adjust the number of data sets displayed.


Using the Project Wizard to create a dynamic table
You can also create dynamic tables using the Project Wizard when opening a new report. The Project Wizard is easy to use and will not be described in detail here.