Another option for data visualization is the gauge object. This object can, for example, graphically display the performance of the calculated values defined in the Computed columns window.
-
From the Insert menu, select the Gauge object.
-
Use the mouse to drag a rectangle in the workspace where you want to place the gauge.
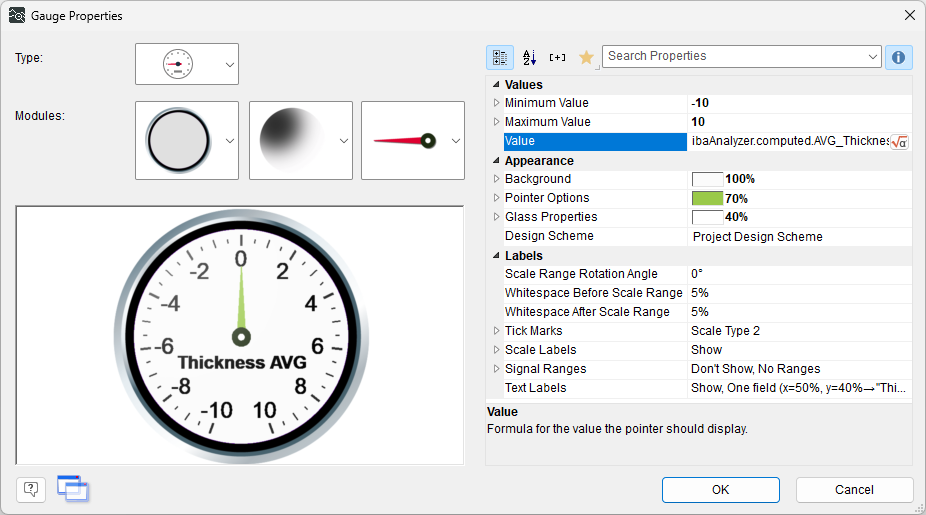
The Gauge Properties dialog opens.
-
On the left side, select the type and modules of the gauge.
-
Under Values, double-click the Value field to select the variable to display from ibaAnalyzer.
On the right side, adjust the properties, e.g., the minimum and maximum values.
Tip

If you set the Signal Ranges field to Show, you can define and display a color scale in the gauge. Specify the respective ranges and colors. Color gradients are also possible.
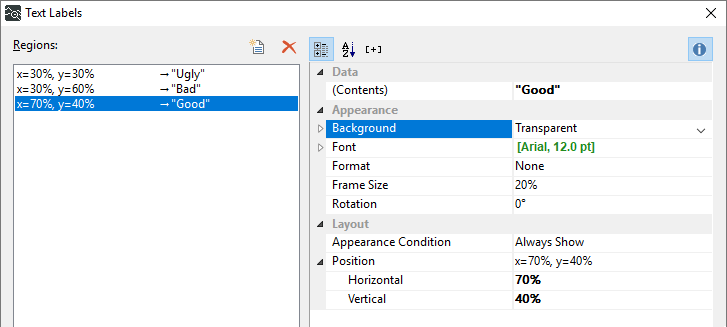
You can also specify display text that depends on the current value. To do this, set the Text Labels field to Show and specify the respective areas and text.
-
Confirm with <OK>.
-
If necessary, resize the gauge using the anchor points on the object frame.
