Table objects offer more options than just displaying text. Among other things, you can also create charts from a table, which is not possible via the Insert menu.
-
From the Insert menu, select the Table object.

-
Use the mouse to drag a rectangle in the workspace where you want to place the table.
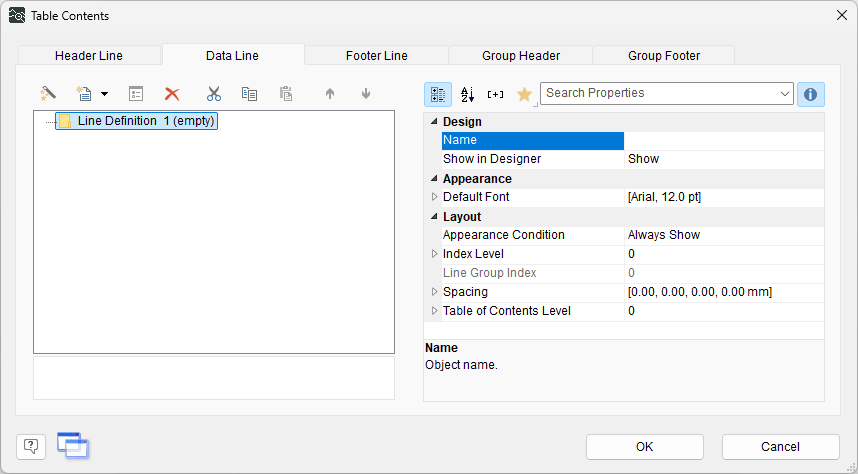
The Table Contents dialog opens.
-
In the Table Contents dialog, click the Append Column icon and select the Chart option.
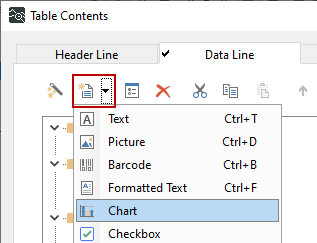
The Chart Properties dialog opens.
-
In the upper section, select the chart type, such as a simple bar chart.
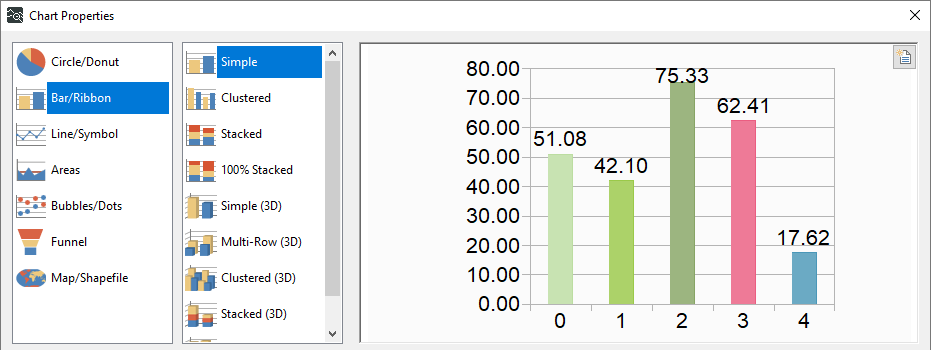
Please note that the chart preview and the editing view in the Report Designer display artificial values that are not related to the data from ibaAnalyzer.
-
In the lower section, you can configure the data to be used.
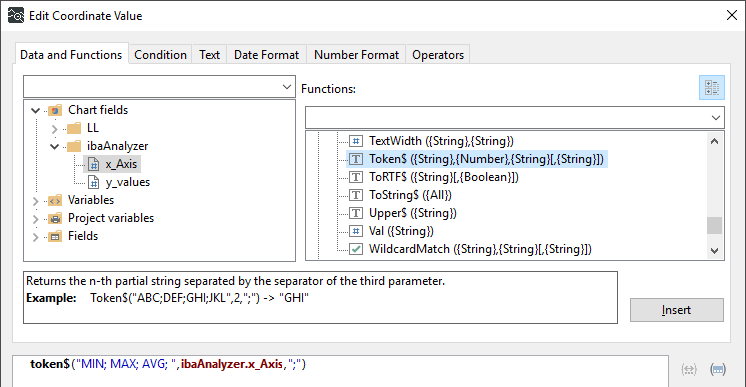
In the Category Axis (x) tab, double-click the Coordinate Value field to open the input form for data from ibaAnalyzer. Use the data you created for the x-axis, see Chart fields.
-
Use the Token function from the string functions to label the bars.
Note that the label only appears when the report is generated via ibaAnalyzer. In edit mode, "Value 1," "Value 2," and so on are used.
-
To preserve the original sort order, set Sort Coordinates to Unsorted in the chart properties.
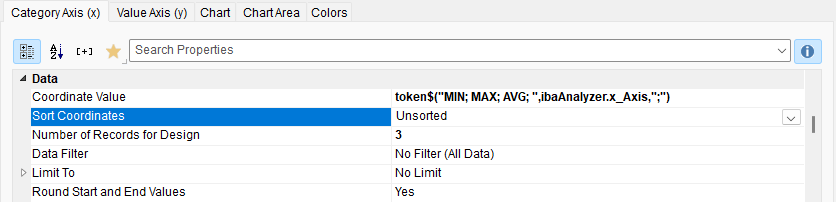
-
In the Value Axis (y) tab, double-click the Coordinate Value field to use the values from ibaAnalyzer for the y-axis.
In the Coordinate Value dialog, select the Custom function option and enter the function using the formula editor.
-
Confirm your changes in both dialogs with <OK>.
-
If necessary, resize the chart using the anchor points on the object frame.


