On the Chart Fields tab, you can provide data that can be used by specific charts in the Report Designer (such as bar, line, or pie charts).

Signals tab
The signal tree on the left contains both the original signals from the DAT file and the generated expressions.
Search tab
You can search for signals in this tab as usual. You can drag the search results directly into the configuration table.
Chart fields
In this field, you can see the chart fields and logical expressions that have already been created.
Red symbols on the icon of a signal indicate upcoming changes to the signal "!" or deletion of a signal "X". When you switch tabs, your entries will be saved.
For further adjustments, see Editing the info columns.
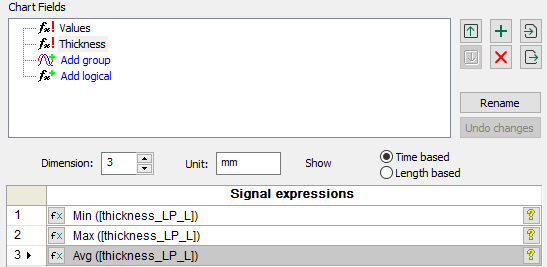
For each chart field, you can define the Dimension, Unit, mode (time-based or length-based), and expressions below it.
Note |
|
|---|---|
 |
For the x-axis, you must always specify index-based values in ibaAnalyzer, ranging from 0 to the number of bars you want. You can rename the x-axis entries in the Report Designer using the Token function. |
<Rename>
Rename the selected logical signal.
<Undo>
You can undo actions on the selected signal before changing the tab.
Dimension
The dimension describes the number of related expressions, i.e., the number of rows in the table below. You can enter a numerical value from 1 to 2048. This setting determines the number of values in a chart field.
Show default: Time based/Length based
Use this setting to specify whether the chart field is time-based or length-based. This information is important to ensure that the charts work properly in the report.
Signal expressions table
In each row of the table, enter an expression for the data to be displayed. If you want to transfer raw signals or existing expressions, you can transfer them from the signal tree in the dialog to the expression table using drag & drop or by double-clicking.
<Swap expressions>
Use this button to reverse the order of the rows.
<Reset expression>
Use this button to clear the content from the fields in the Signal expressions column. The other settings of the chart field are retained, such as name, dimension, unit etc.
Context menu in the Logicals area
You can use the context menu to change the signal reference (signal name or number), sort the logical signals alphabetically, or delete all definitions.

Display in Report Designer
You can only access the data in the chart fields when creating or editing a chart in the report. The chart fields are available in the Variables/Fields list in the Report Designer.

Example: Enter data for the bar chart
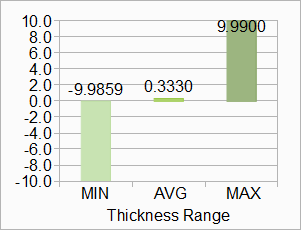
The following example illustrates the importance of the settings in the ibaAnalyzer dialog for creating a simple bar chart with minimum, mean, and maximum values in the Report Designer.
-
Rename the default field "ChartField_001", for example, to "x-axis".
This field represents the x-axis of the resulting chart, i.e., the number of bars.
-
Enter "3" as the dimension and enter the values 0, 1, and 2 in the rows. (For the Report Designer, indexing must start at 0.)
-
Use the <+> button to add another chart field and enter a name (e.g., "Thickness").
This axis defines the value of the data points, i.e., the bar height or the y-axis.
-
Set the Dimension to the same number as the x-axis.
-
Select the Time-based option.
-
Enter the values in the Signal expressions fields.
-
In the Report Designer, you can use this data to create a bar chart. For more information, see Inserting bar charts.
The result in the Report Designer might look like this, for example:
Note
In the Report Designer, you initially see only sample values and placeholders that do not correspond to the signal data or defined labels. The correct values only appear when the report is generated via the ibaAnalyzer menu.
