The view’s trigger is visualized on the chart by a little circle with a dot inside. If the trigger can be moved, trigger markers appear at the side of the chart, near the base and value axes. The trigger can be moved by dragging these markers.
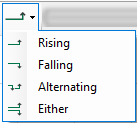
There are four triggering slopes:
|
Edge type |
Description |
|---|---|
|
Rising |
Trigger can only fire on the rising edges of the trigger signal |
|
Falling |
Trigger can only fire on the falling edges of the trigger signal |
|
Either |
Trigger can fire on both falling and rising edges of the trigger signal. |
|
Alternating |
If the trigger previously fired on the rising/falling edge, it will fire the next time on the falling/rising edge. |
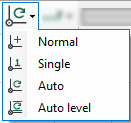
There are four trigger modes:
|
Trigger mode |
Description |
|---|---|
|
Normal |
Trigger fires every time the trigger signal passes the trigger value |
|
Single |
Trigger fires when the trigger signal passes the trigger value for the first time. |
|
Auto |
Like normal mode, but also fires when a time-out expires. |
|
Auto level |
Like auto mode, but the trigger value is set to the trigger signal’s center value |
The trigger mode and slope can be set in the toolbar or in the “properties” dialog of the view.
 |
 |
To enable the trigger, click the “Play” button ![]() in the toolbar. To disable the trigger, click the Pause button
in the toolbar. To disable the trigger, click the Pause button ![]() . If the trigger is disabled, it will not scan incoming samples.
. If the trigger is disabled, it will not scan incoming samples.