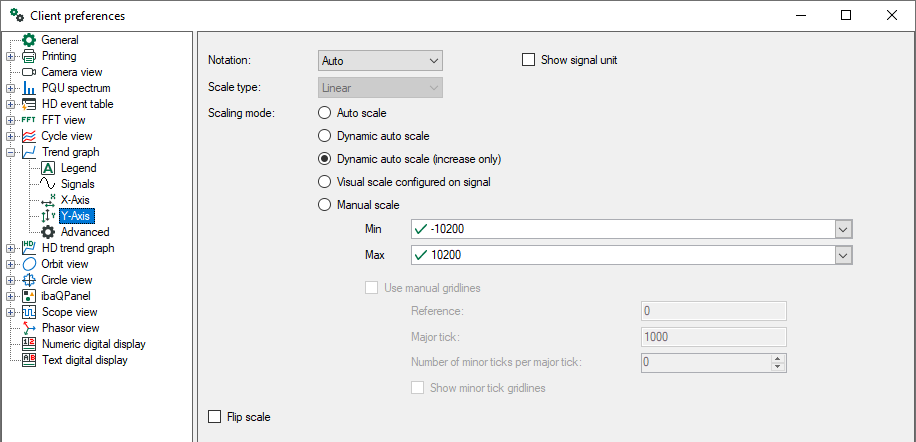
In the preferences, you will find the branch for setting up the Y axes.
If you open the "Properties" dialog of a trend graph view, you will find one branch for each graph in the view as well as subordinated branches for each Y axis of the corresponding graph (see picture below).
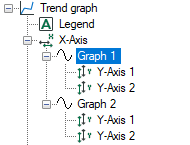
Thus, you can set up all Y axes individually.
Scientific notation
Choose from the pick-list in this field:
-
Auto: Depending on the size of the scale values (number of places before or after the decimal point), the scales are labeled in scientific notation (power of 10) or not.
-
Standard: Scale values always with digits before and behind the decimal point
-
Scientific: Scale values in powers of 10
Optionally you can enable the indication of the signal unit.
Scaling mode
-
Autoscale: this is the default setting; if one or more signals are displayed, the Y-axis of the graph is scaled in accordance with the smallest and largest of all values occurring.
-
Dynamic auto scale: if you enable this option, the scaling is always adjusted to the highest and lowest signal amplitudes in the graph (in both directions).
-
Dynamic auto scale (only for enlarging): When you enable this option, the scaling is continuously adjusted with the highest signal amplitudes. If the amplitudes go beyond the trend view again, the scaling still remains unchanged.
-
Manual scale: if this option is selected, the Min and Max scale values can be manually entered or selected from the field next to it. Beside a static value, you can also use any known measured or virtual analog signal configured in the I/O manager. In order to select a signal for minimum or maximum scale, open the pick-list of the corresponding field and make the selection in the signal tree.
Using manual grid lines
This option is only available if the manual scaling is enabled.
With the parameters to be entered, you can alter the Y axis and grid lines.
-
Reference Enter any value to be considered as reference for the basic grid line. Usually, the basic grid line is at value 0 (zero). Depending on your needs, the basic grid line can also have, for example, the value 10 or -25.
-
Major tick Enter a value for the major ticks' distances on the Y-axis. Every major tick is linked to another grid line. The major ticks determine the horizontal grid lines in the graph. Depending on the total scaling, a major tick can be set every 10 s, 100 s or every 0.1 s.
-
Number of minor ticks per major tick Enter a value complying with the number of minor ticks between two major ticks. This determines the granularity of the Y-axis. Optionally, you may enable grid lines for minor ticks.
Example
|
1 |
 |
2 |
 |
3 |
 |
|
Reference |
Major ticks |
Minor ticks per major tick |
|
|---|---|---|---|
|
1 |
0 |
10 |
0 |
|
2 |
0 |
5 |
5 |
|
3 |
1 |
4 |
4 |
Trend graph settings for reference, major ticks and minor ticks (example)
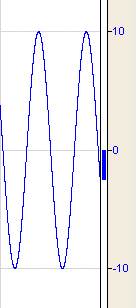
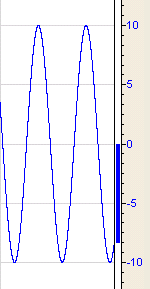
Flip scale
By enabling the option Flip scale you can swap the scale top-down.
Color (only available in the properties)
You have the possibility to assign a certain color to a Y-axis. When set to automatic mode (default) the Y-axis always has the same color like the related signal. If multiple signals are attached to the same y-axis, its color is determined by the topmost signal in the legend.