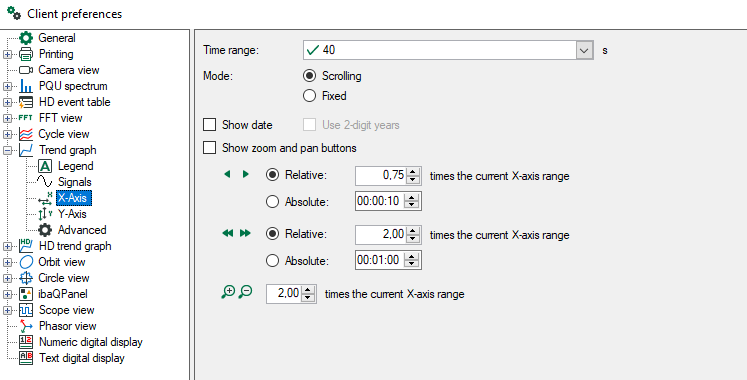
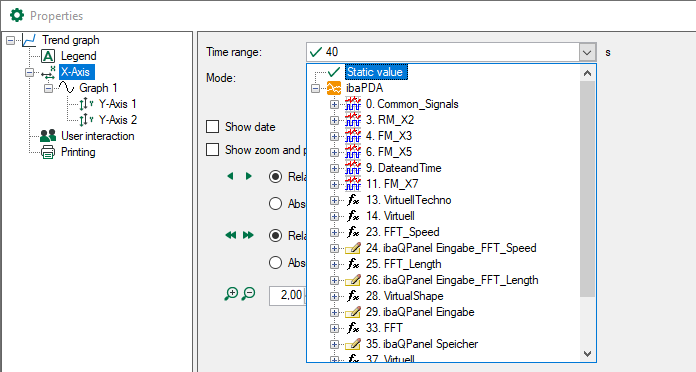
Time range
You can configure the time range represented by the X-axis. If you reduce the value, the signal will move faster on the display and changes to an expanded form. If you increase the value, you will see more measuring points in the graph and the signal will move slower. In the preferences, you can only set a static value. In the properties of a specific trend graph view, you can select an analog signal controlling the length of the X-axis.
Mode
Scrolling: Usually, the time axis moves along with the incoming samples (default).
Locked: If you enable this option, the signal will be written into the static graph. Once the signal curve has reached the end of the visible time range, the display shifts to the next (empty) time unit and continues to write samples.
Show date
By enabling this option, the date (MM/DD/YYYY) is displayed at the ticks of the X-axis. Optionally, you can reduce the year by 2 digits (MM/DD/YY).
Show zoom and pan buttons
If you enable this option, the zoom and pan buttons will be displayed along the X-axis.
Default settings are:
-
for small panning steps: 0.75, relative
-
for large panning steps: 2.00, relative
-
for zooming 2.00
Alternatively, the panning steps can be set as absolute value in the HH:MM:SS time unit.