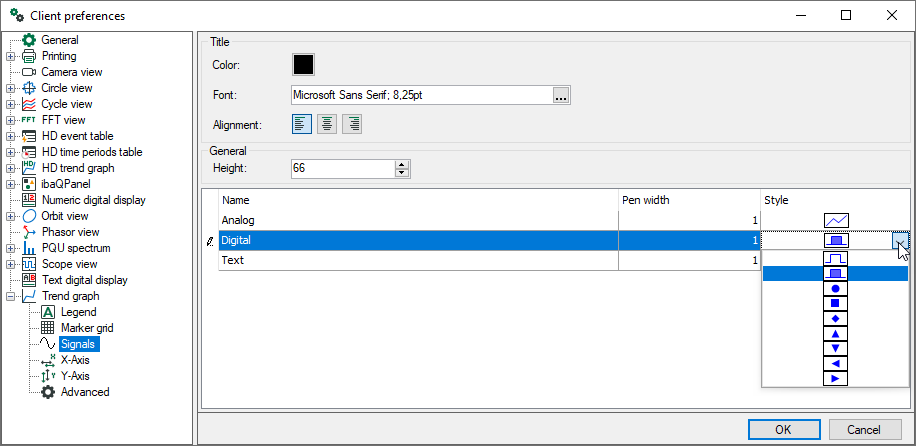
In this dialog you can generally define how the curves should be initially displayed. The default setting for curves of analog values is a simple line (line thickness 1), and for digital signals a filled area. Text signals will be displayed in standard font.
You can also select other styles for analog, digital and text signals. Click in the "Style" column. A selection list opens there of the different styles.
|
Symbol |
Description |
|---|---|
|
Analog signals |
|
 |
Line; Curve filled up to zero line; Curve filled to bottom; Curve filled to top |
|
Digital signals |
|
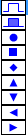 |
Line; Curve filled up to zero line Geometric symbols are displayed at the rising edge of the signal |
 |
Normal; bold; italic; bold & italic |
If you select a symbolic style for a digital signal then this symbol is only displayed on the x-axis where there is a rising edge of the signal. The remaining signal curve (TRUE or FALSE) is not displayed. Example: strip entry in a 7-stand rolling mill
The figure below shows in the upper part a trend of digital signals in standard style, the lower part shows the digital signals in symbol style together with some analog signals.
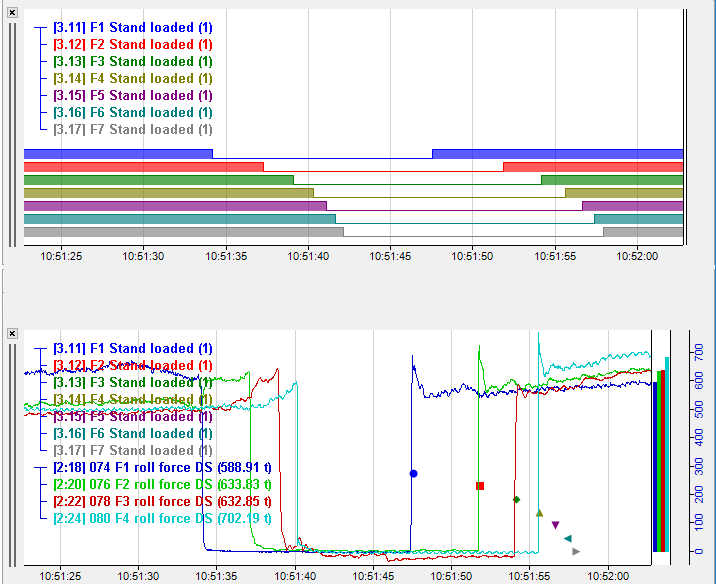
The symbolic style can be useful if the trend display would be overloaded in the standard style, especially when digital and analog signals are presented mixed.
Transparent colors are used for filled curves to avoid one hiding behind the other. The line width can be adjusted in pixels.
In the "Properties" dialog of a trend graph view, you can set up the style for each curve individually. There you will find one or more "Graph x" branches. X is the numbering of the different graph charts within a trend graph view. Under the "X-axis" branch, you will find signals with their properties, grouped by the charts in the view. The following figure shows the properties of a trend graph (view) with two graph charts (graph 1 and graph 2) with two Y-axes each. Graph 1 contains two signals.
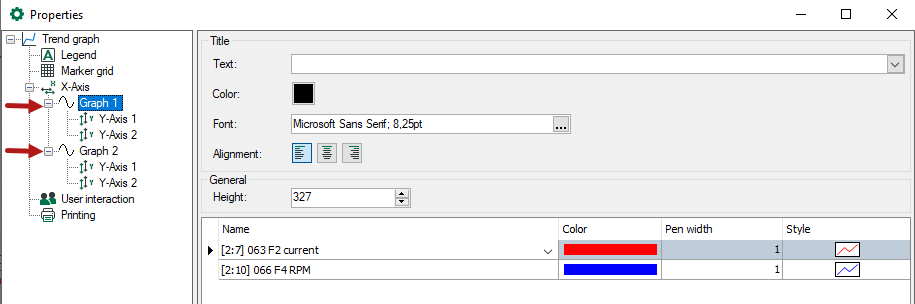
In the "Color" column, you may change the color of a signal by selection from a pick-list.
In the preferences you will find these settings under Trend graph - Signals.
Set up the graph height
In the General area you can determine the minimum height of a graph for its display in a trend graph view by setting the Height parameter. The value is given in pixel. A default value of 66 is given in the preferences.
However, a graph will be displayed with maximum possible height when a signal is dragged into an empty trend graph view. Adding more trend graphs will divide the height in equal shares automatically as long as you did not set the height of one or more graphs manually. If there are more trend graphs open in a trend view than space available with regard to the minimum height, a scroll bar appears.
You can adapt the height for each graph in the properties later.