The marker grid is a table, which is shown underneath a trend graph, displaying values of the signals in the graph referring to the positions of the two markers X1 and X2.
On the node Marker grid in the preferences or properties of the trend graph you determine the look of the table and when it is to be displayed.
Header
Select the desired foreground color here. This will be the color of the characters in the column headers of the table.
General
Visibility
Chose from 4 options for displaying the marker grid:
-
Never visible
-
Visible when paused
-
Always visible
-
Manual
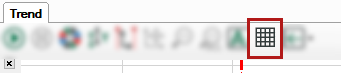
If you choose "Manual", an additional button will appear in the toolbar, which you can use to show or hide the table at any time.
Background color, Gridlines color, Font
Here, you can set up the background color of the table cells and the color of the grid lines as well as font type and size.
Focused row
Background color
By setting the background color you determine how a table row will be highlighted when selected with the mouse.
Foreground color
This setting determines the font color in case a row is selected. Typically, this is the signal color (default). However, you may choose a different color, in order to generate more contrast in conjunction with another background color, for instance.