If you do not want to remove signals in a trend curve but just temporarily hide them, you can use the function for hiding and displaying a signal.
You have the following options:
-
By right-clicking on the signal name in the legend, you can display or hide a signal in the context menu.
-
If the signal table below the trend curve is open, remove the check mark in the far left column (monitor icon).
-
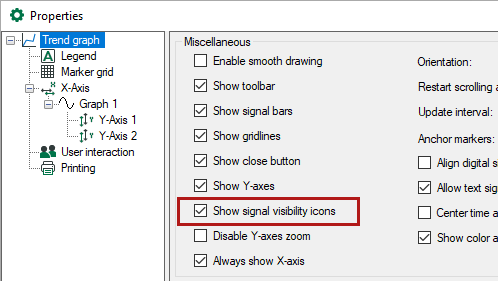
If you have enabled the "Show icons to hide signals" option in the properties of the trend display, you can show and hide the signal by clicking on the monitor icon in the signal legend.
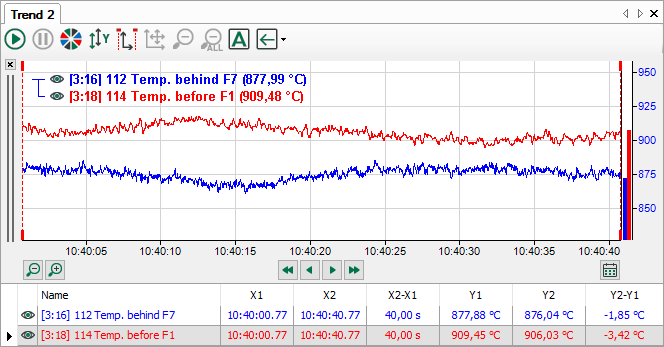
The figure above shows both signals visable, the figure below shows the red curve hidden.
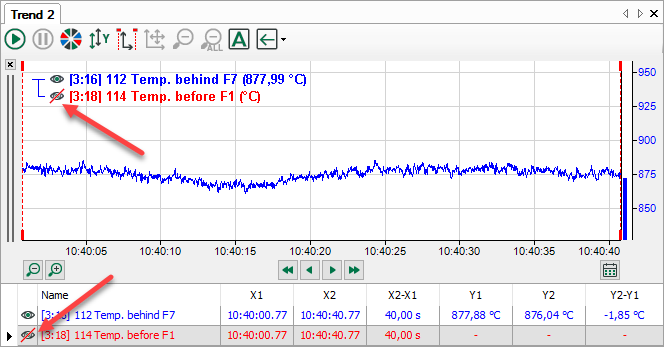
If a signal is hidden then the signal bar is also empty and no marker or actual values are displayed in the signal table.