You can define a title within a trend graph view for each signal chart (graph).
To do this, right-click in the desired signal chart and select Properties... In the Properties dialog, select the graph for which you want to define a title. Now, you can enter a title and determine the font, color and alignment of the title bar.
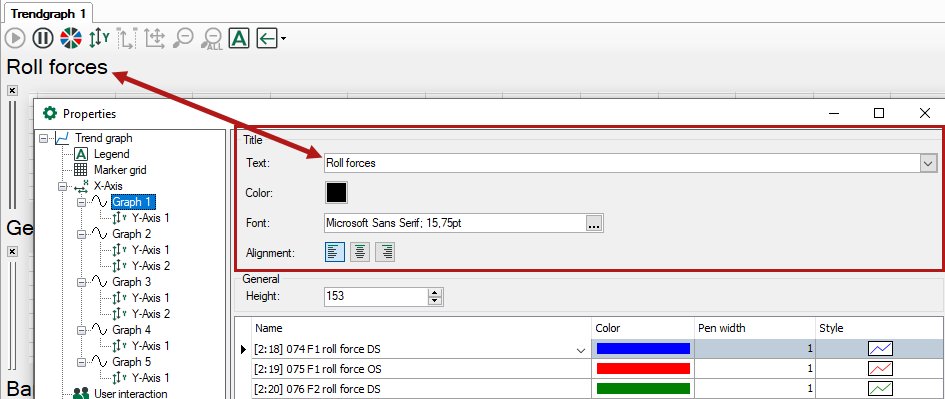
More curves, which are part of the trend display, can be reached in the same dialog. Each graph or graph group in a trend display can receive its own title.