Each view has a couple of control buttons in its own toolbar.
Depending on the display type, the toolbars for trend graph, oscilloscope, FFT view, camera view or QPanel differ.
The following describes the trend graph toolbar. For description of the other tool bars, please refer to the corresponding chapters.
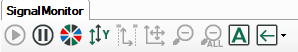
The functions are (from left to right):
Start scrolling
Only enabled if <Pause scrolling> button was pressed before. Restarts the scrolling of the display at the current time.
Shortcut key: <F6> (toggle)
Pause scrolling
Only enabled if the display is scrolling. Stop the continuous display. After clicking this button, the display stops scrolling. A signal table ("Marker table") appears below the signal chart and two rulers are shown in the signal display. The rulers can be moved with the mouse along the X-axis. The corresponding Y-values are displayed in the table below the trend view. The X-axis can be moved with the mouse. This enables the user to see values from the past. For more pause mode control options, see X-axis buttons.
Shortcut key: <F6> (toggle)
Automatically assign signal colors
All curves of this display are colored per signal chart according to the standard scheme.
Also see Settings, chapter Properties and preferences trend graph
Autoscale all
All curves of this display are automatically scaled per signal chart and Y axis.
Shortcut: <F5>
Zoom and auto scale between markers
Only enabled in pause mode.
View zooms into range between the markers X1 and X2 and the Y-values are auto scaled.
Restore manual scale
Only enabled if a manual scaling has been defined in the settings of the signal chart. The manual scaling are restored (where defined) after an autoscaling or zooming action.
Zoom out one step
Only enabled if the display has been zoomed. Return to the previous zoom factor (reduce).
Shortcut: <F3>
Zoom out all
Only enabled if the display has been zoomed. Will zoom out to initial (automatic) zoom level (no zoom) according to axes settings.
Shortcut: <F4>
Change legend style
With every click on this button, the legend in the trend graph changes between transparent, opaque and invisible.
Change orientation of graphs
Drop-down menu for selection of scrolling orientation.
The entire toolbar as well as single toolbar buttons can be hidden. In order to do so, use the context menu (see next chapter).